
Sci-Fi Pie Charts: an MSc dissertation on films
Sci-Fi Pie Charts: an MSc dissertation on films
Whilst writing up his MSc dissertation, Edvin Dudinskij tweeted some images from his research. Edvin was investigating the use of visualisations in science fiction movies, and the idea and images became very popular on Twitter, making it onto the top ten data journalism tweets in August.
We spoke to Edvin about how he came to an idea that was of interest to digital artists, software developers, data journalists all the way to computational biologists.
CIM: There has been a lot of interest in your dissertation on Twitter. How did you decide on that topic?
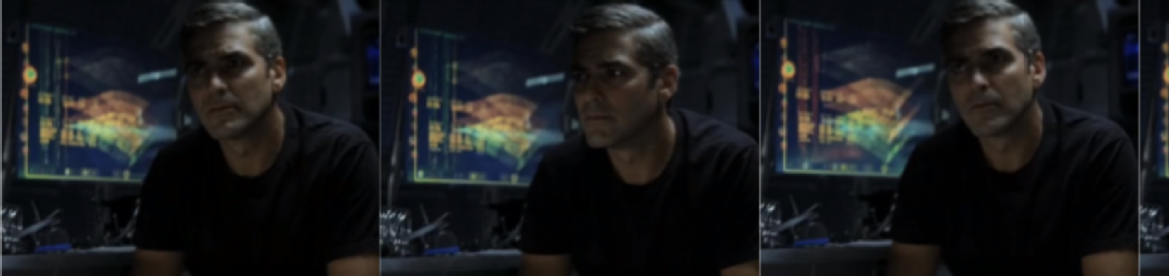
EDVIN: I first thought about data visualisation in science fiction movies as a topic for my dissertation during a conversation with other CIM students. We were discussing possible dissertation topics and somehow the conversation went about new Avengers movie, and the visualisations in the film. This gave me the initial idea to investigate how science fiction movies use data visualisation as part of the scene element to deliver film’s narrative. Furthermore, I was always interested in science fiction movies and having an opportunity to study visualisation as part of my degree program gave me even more reasons to combine two disciplines in my thesis: film studies and data visualisation. This meant I had to research and design a new method from an interdisciplinary approach.
CIM: Studying films may seem slightly unusual for an MSc student. How does this fit with your background and studies over the last year?
EDVIN: To be honest if someone would tell me at the beginning of the academic year that I will be writing thesis about data visualisation in science fiction movies I would not believe it. My background was in business management, working for corporate firms as a data analyst. Studying at CIM gave me the confidence to step out of my comfort zone and write a dissertation from an interdisciplinary angle. At CIM you are always challenged to think differently and in an interdisciplinary way. CIM is a great environment to be in as it allows you to be creative and innovative with data in your own way.
CIM: And what did you find in your dissertation research?
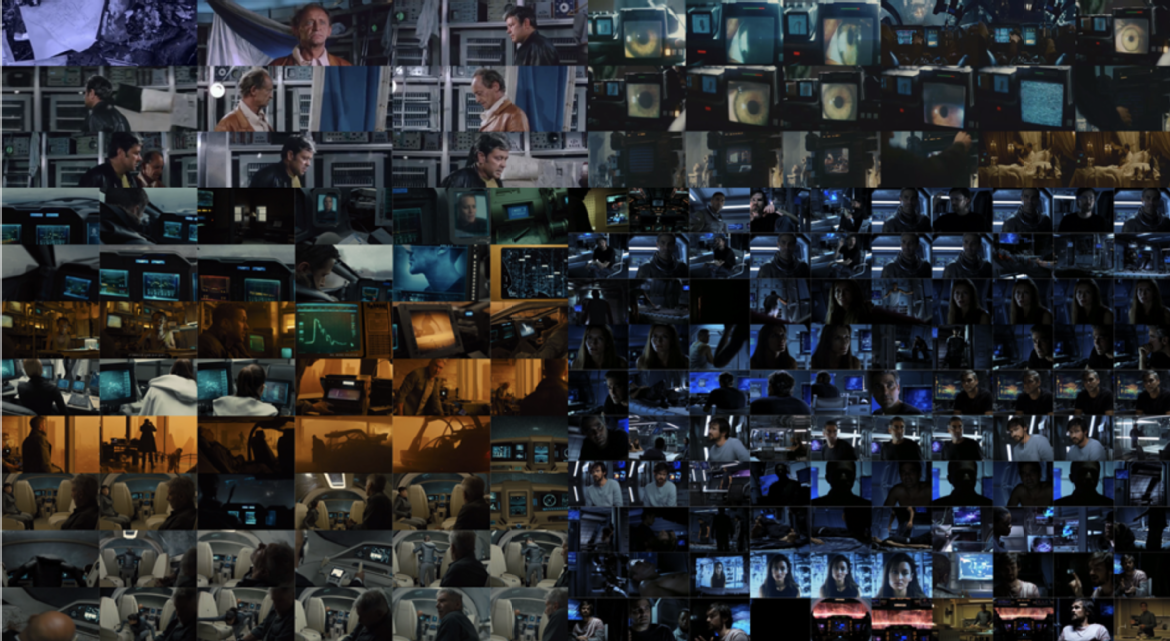
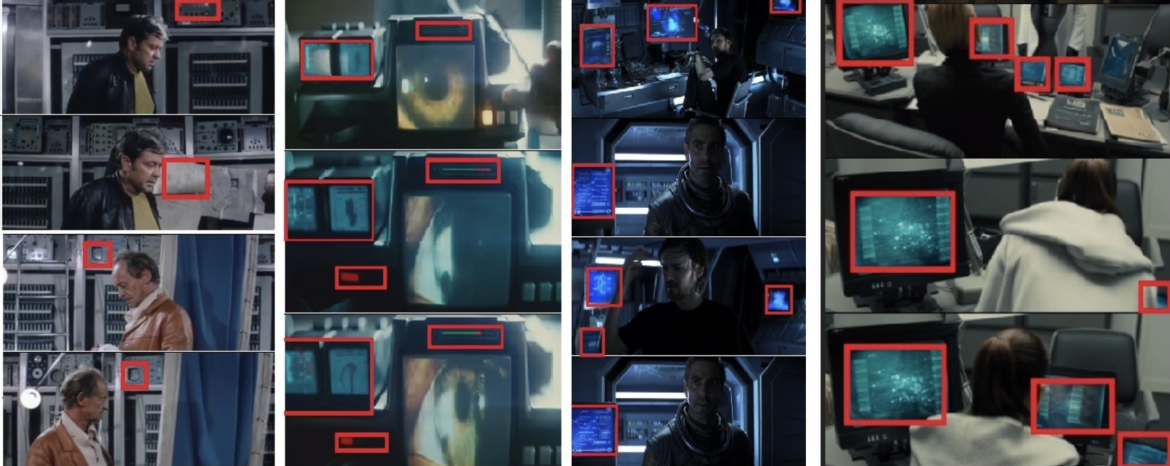
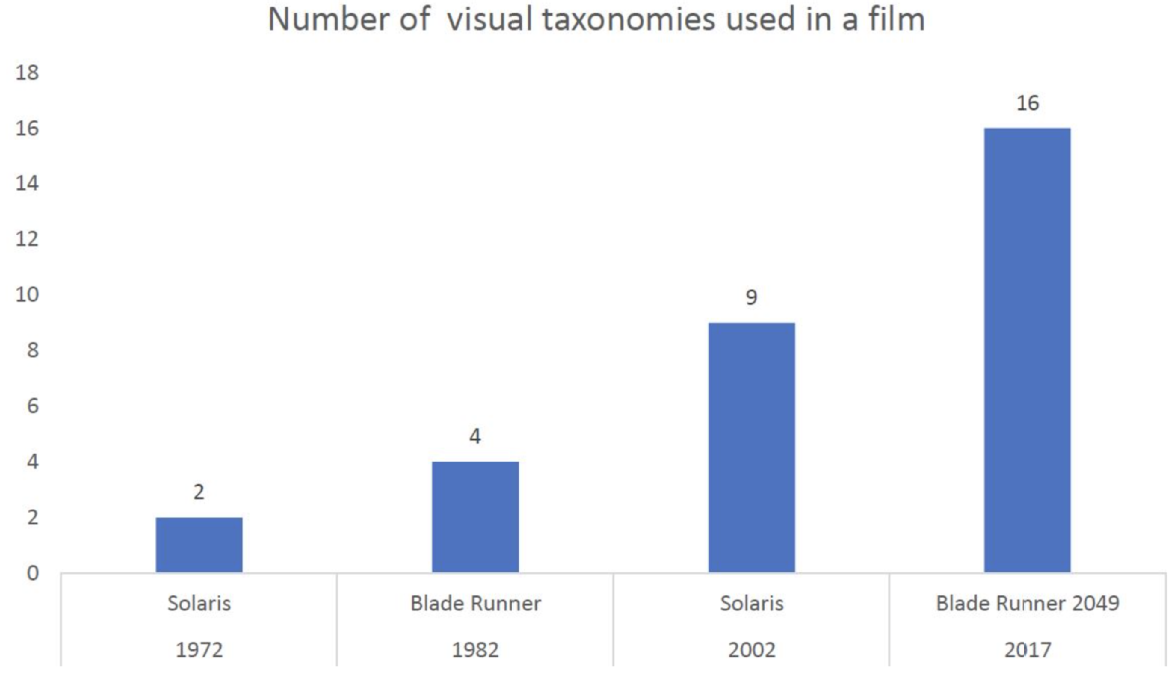
EDVIN: My results indicated that through time data visualisation usage increased in science fiction movies. Furthermore, having movies with similar storylines revealed a consistent image of scientists surrounded with the data visualisations. The variety and complexity of visualisations shown in the movies increased through time, which might indicate that viewers’ knowledge about visualisations expanded too.
CIM: Now that you have finished your Masters course, what do you hope to do next?
EDVIN: At the beginning of the year I was sure that I would go back to a corporate company and work as a business analyst. But this degree changed my perspective on how I see the digital world and how data could be utilised, analysed, and presented from a social side. The whole academic journey was a challenging, but a rewarding experience. CIM teaches you about methodologies and approaches, and the longer term implications of data for society, which prepares you to have a career in a digitally enhanced world. Thus, in the short term I am concentrating on finding a job that fits my new knowledge and experience. In the long term, I am planning to have my own consultancy company that could help educating and advising businesses about social side of the Big Data.
CIM: Thanks for your time Edvin and good luck with your next steps.
Edvin studies the Big Data and Digital Futures MSc with the Centre for Interdisciplinary Methodologies (CIM) and the Warwick Q-Step centre. Our Big Data students work alongside students in the MSc in Urban Informatics and Analytics and MA in Digital Media and Communication postgraduate degrees through a range of modules which allow students to tailor their degree to interests and goals. More details on our postgraduate degrees, and the funding available, can be found on our study pages.