Development of Platinum-free Dye-sensitized Solar Cells
Grace Lowe[1], School of Chemistry, University of Nottingham
Abstract
Cyclic voltammetry has been used to study the reduction of a disulphide-based redox couple for dye-sensitised solar cells (DSSCs) at a series of catalyst surfaces. The catalyst materials were platinum (Pt), poly(3,4-ethylenedioxythiophene) (PEDOT) and glassy carbon (GC). Reduction of the mediator was most efficient at PEDOT, while the kinetics of electron transfer appeared to be particularly slow at Pt. At GC, the electrochemical reaction caused poisoning of the surface. These results demonstrate that PEDOT is a particularly promising alternative to Pt for the development of DSSC cathodes.
Keywords: Solar power, electrocatalysis, solar cell, energy, dyes, chemistry
Introduction
The atmospheric concentration of CO2 and other "greenhouse" gases has increased steadily since the beginning of the industrial revolution due to the combustion of fossil fuels for power generation. The release of CO2, methane and steam from "anthropogenic" sources is problematic because the materials absorb high-energy infra-red (IR) radiation from the sun and release it as lower energy IR that cannot escape the atmosphere back into space. The result of the increasing concentration of these gases in the atmosphere is a steady increase in the average temperature of the Earth leading to global climate change (Totterdell et al., 2000). Current projections indicate that the global population will increase significantly in the next few decades The United Nations Department of Economic and Social Affairs' Population Division, 2004) and this will also result in an increasing demand for energy. This anticipated demand, combined with the fact that fossil fuels will inevitably run out, mean that the race is on to find a new, renewable energy supply.
Solar cells that convert photons of sunlight directly into electrical energy are commercially available, but due to the high costs, we still rely on gas and coal-fired power stations for most of our electrical energy (The Department of Energy and Climate Change, 2012). DSSCs are an alternative to conventional, silicon-based solar cells and Figure 1 illustrates how they work. Dye is coated on to a semiconductor and electrons in the dye are excited by absorption of photons from the sun. The high-energy electrons are then transferred to the conduction band of the semiconductor. This dye-coated semiconductor is known as the photoanode. Once in the conduction band, the electrons are conducted around the circuit to a cathode. To complete this circuit and regenerate the dye molecules, a molecule known as a redox mediator is used to shuttle the electrons from the cathode to the photoanode.
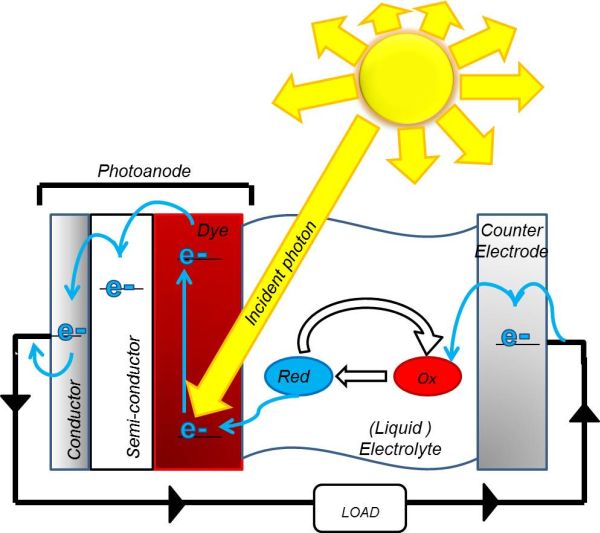
Figure 1: A diagram of a DSSC showing the reduction and oxidation of the redox couple. First photoexcitation occurs due to the incident photon. Then the electrons are conducted around the circuit to the cathode, where they reduce the redox mediator, which is then oxidised to regenerate the dye.
The most common redox couple is tri-iodide/iodide (I3-/I-) (Boschloo and Hagfeldt, 2009). I- is oxidised to I3- at the dye (Equation 1) and I3- is reduced to I- at the cathode (Equation 2):
3I- -> I3-+ 2e- (1)
I3-+2e- -> 3I- (2)
Solutions of these two ions are highly corrosive and coloured, which reduces the lifetime of a DSSC containing this redox couple, as well as absorbing some photons that would have been absorbed at the photoanode. An organic disulfide/thiolate based redox couple, 5-mercapto-1-methyltetrazole dimer/5-mercapto-1-methyltetrazole ion (T2/T-), forms a colourless non-corrosive solution in acetonitrile (ACN) and has high photon to current conversion efficiencies in DSSCs (Grätzel et al., 2010). Hence, in our investigation we used the T2/T- redox couple rather than I3-/I-. At the cathode of a DSSC T2 is reduced to T-:
2e- + T2 -> 2T- (3)
The cathode reaction is also illustrated in Figure 2. T- then diffuses to the photoanode and is oxidised to T2 (Equation 4) regenerating the dye.
2T- -> T2 + 2e- (4)
The reduction of T2 is the reaction we are interested in, because the rate of this reaction can limit the overall rate of photon conversion, as well as the proportion of incident photons absorbed. The cathode surface acts as a catalyst for this reaction and the current standard cathode material is Pt. As Pt is expensive, there has been a lot of work done on characterising potential replacement catalysts, such as copper oxide nanorods (Yang et al., 2005). Most potential cathode materials were analysed using different redox mediators to T2/T-, like cobalt polypyridene complexes (Boschloo et al., 2010).
Grätzel has compared PEDOT and cobalt sulphide counter electrodes in DSSCs to Pt using T2/T- and found that PEDOT was the best performing counter electrode material (Grätzel et al., 2011). In this study, we used GC and bulk Pt electrodes, whereas Grätzel's comparison involved platinum nanoparticles mounted on a polymer semiconductor. Here, we compare the kinetics of the reduction reaction using cyclic voltammetry, rather than analysing cells with electrochemical impedance spectroscopy.
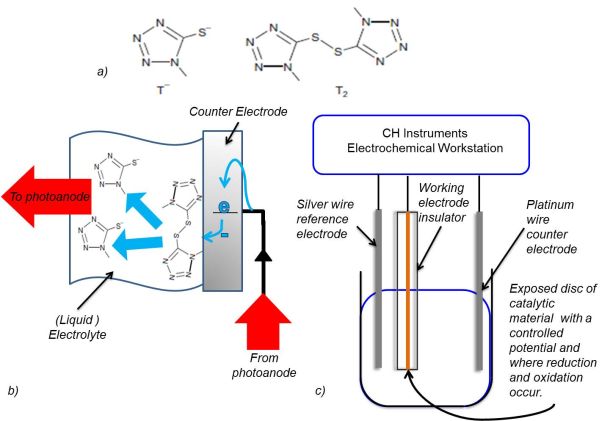
Figure 2: T2 reduction at the cathode and working electrode. a) Skeletal structures of T2 and T- (Grätzel et al., 2010). b) A diagram of the reduction of T2 at the cathode in a DSSC. c) The setup of the electrolytic cell used to analyse the reduction and oxidation of T2.
Experimental Section
The method of analysis used in this investigation was cyclic voltammetry. Figure 2 illustrates how the working electrode imitated the cathode in a DSSC. Three different working electrodes were used: a 5mm radius electrodeposited PEDOT disk on a fluorine doped tin oxide (FTO) glass electrode, a GC disk electrode radius 3mm and a Pt disk electrode of radius 2mm. A silver wire reference electrode and a Pt wire counter electrode were used. The sample solution contained 0.1 mM T2 and 0.1 M tetrabutylammonium hexafluorophosphate (TBAPF6) in acetonitrile (ACN). ACN was the solvent and TBAPF6 prevented mass transport of the analyte due to migration. The potential was varied at a scan rate of 100 mV s-1 using a CH Instruments Electrochemical Workstation and the accompanying software.
To construct the conducting polymer electrode, 3,4-ethylenedioxythiophene (EDOT) was electropolymerised onto FTO coated glass. The glass was exposed to 0.1 M EDOT in 1-butyl-3-methyl imidazolium bis(trifluoromethanesulfonate)imide and held at 1.2 V for 30 s in a deposition cell, with a silver wire reference electrode and Pt wire counter electrode.
Results
Cyclic voltammetry is a controlled potential technique, in which the potential (E) of the working electrode is swept between two values and the resulting current (i) is measured. Sweeping from a positive to a negative potential reduces the electroactive species at the working electrode surface. The current measured during a negative sweep is the cathodic current. The transfer of electrons from the electrode surface to the reactive species results in an increase in the cathodic current. The decrease in current that gives the peak shape occurs when the rate of diffusion of reactants to the working electrode surface begins to limit the rate of reaction. Sweeping from a negative to a positive potential oxidises the reduced electroactive species at the working electrode surface back to its oxidised form, resulting in a peak in the anodic current.
The data is plotted as a graph of E against i. These graphs are referred to as voltammograms and Figure 3 shows the voltammogram for T2/T- reduction/oxidation at PEDOT. Sweeping the potential from positive to negative gave a peak for T2 reduction at 0.362 V. Upon sweeping the PEDOT working electrode from negative to more positive potentials, a peak was observed at 0.475 V for T- oxidation. The distance between these two peaks was 0.095 V and the voltammogram was stable over 50 cycles. For each material the rate at which the voltage was changed, the scan rate, was kept constant at 0.1 V s-1. This allowed us to use the distance between the peak caused by the reduction of T2 and the peak caused by the oxidation of T- (peak-to-peak separation) to compare the rate of the reactions at the electrode surface. A small peak-to-peak separation indicates a fast rate of reaction at the electrode surface, while a peak-to-peak separation larger than 28.5 mV, (for an electron transfer process involving two electrons) indicates slow kinetics.
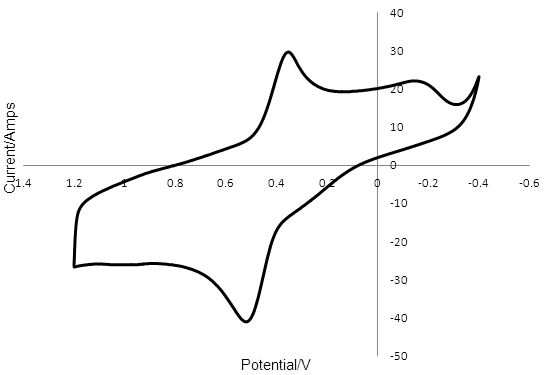
Figure 3: Cyclic voltammogram of a 5mm PEDOT electrode in 0.1 mM T2 and 0.1 M TBAPF6 in ACN with a Pt wire counter electrode and a silver wire reference. The peak at 0.362 V was due to the reduction of T2 and the peak at 0.457 V was due to the oxidation of T -.
The voltammogram obtained for T2/T- reduction/oxidation at Pt (Figure 4) showed a peak at -1.533 V for the reduction of T2. The oxidation peak for T- was observed at -0.750 V and has a considerably smaller area than the cathodic peak. The peak-to-peak separation was 0.783 V.
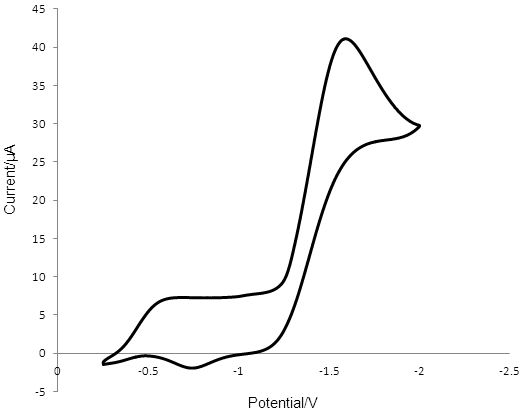
Figure 4: Cyclic voltammogram obtained in 0.1 mM T2 containing 0.1 M TBAPF6 and ACN, showing the reduction of T2 and the oxidation of T - at the surface of a 2mm radius Pt disk electrode. A silver wire reference electrode was used and the counter electrode was Pt wire. The reduction peak for T2 is at -1.533 V and the corresponding oxidation peak is at -0.750 V.
The cyclic voltammogram obtained for T2/T- reduction/oxidation at GC is shown in Figure 5 and was unstable over 50 potential cycles. The reduction peak for T2 shifted from 0.194 V to -0.108 V, while the oxidation peak due for T- shifted from 0.636V to 0.832 V. The peak-to-peak separation increased from 0.442 V to 0.724 V, while the anodic and cathodic currents decreased.
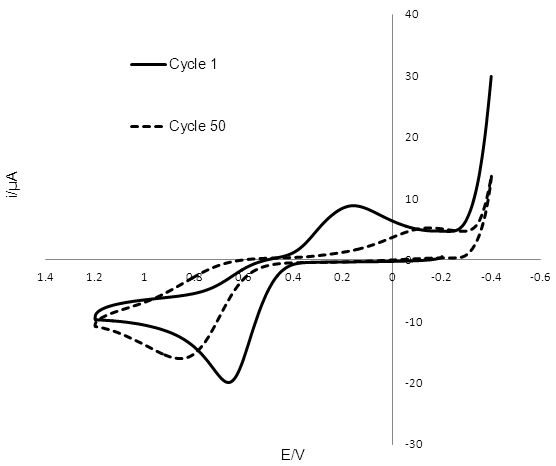
Figure 5: Cyclic voltammogram of 2mm radius glassy carbon electrode in T2 solution, with a silver wire reference electrode and a Pt wire counter electrode. The reduction peak for T2 shifts from 0.194 V to -0.108 V after 50 potential sweeps, while the oxidation peak due to T-, shifts from 0.636 V to 0.832 V.
Discussion
The relatively small peak-to-peak separation for T2/T- reduction/oxidation of 0.095 V at PEDOT compared to 0.783 V for the reaction at Pt indicates that the rate of reduction and oxidation of the redox mediator is much faster at the PEDOT surface than at the Pt surface.
Comparing the initial peak-to-peak separation of 0.442 V of the voltammogram of the GC catalyst indicates a faster rate of reduction than at the Pt surface with a peak-to-peak separation of 0.796 V. However the peak-to-peak separation at GC continued to increase with each cycle of the potential up to 0.724 V after 50 cycles, as shown in Figure 5. This value is close to the peak-to-peak separation at Pt, suggesting similar rate constants for the electron transfer reaction. It is also interesting to note that prolonged exposure of the GC electrode to the redox mediator and varying potentials led to the poisoning of the electrode. After 50 cycles the poisoning mechanism formed a visible deposit on the electrode surface that spread onto the plastic insulator. This data suggests that the rate of electron transfer slows down as the deposit forms. Even though Pt has a slower initial rate of electron transfer than GC there is no apparent poisoning and the voltammogram for Pt remains relatively stable. The difference in the anodic and cathodic current peaks at Pt could be indicative that some material is lost in forming an electroinactive product before T- is oxidised back to T2. The drop in current at GC upon potential cycling and the formation of the deposit on the electrode surface requires more investigation.
Conclusion
Using the organic redox couple T2/T-, it is theoretically possible to construct a DSSC with a PEDOT cathode that has more efficient incident photon conversion than a similar DSSC with a Pt cathode. The faster rate of reduction of T2 at PEDOT compared to at Pt would allow the reduction of the oxidised dye to occur faster. Due to the poisoning observed on the GC electrode, a DSSC with a GC counter electrode and T2/T- redox couple would not be viable because the cell would have a short lifetime. The kinetics of T2 reduction at Pt and at GC were more complex than expected and require further investigation. Further study of PEDOT in DSSCs with organic redox couples may yield favourable results in the future. This research also indicates that conductive polymers may provide a new direction for electrocatalysis using non-corrosive redox couples. The next step is to construct a DSSC with PEDOT and T2/T- to subject to accelerated lifetime testing, as well as to measure whole cell efficiency. The long term stability of PEDOT and the organic redox couple need to be characterised.
Acknowledgements
I would like to thank Dr Pete Licence, Dr Darren Walsh, Dr Lee Johnson and Andinet Ejigu for their expertise in ionic liquid synthesis and electrochemistry. Especially Dr Johnson for the data used to construct figure 4. I also thank Dr Soon Yee Liew, Professor Martyn Poliakoff, Martin Luck, the BCUR and the Reinvention Journal for the opportunity to submit this work. Thanks are also due to the 1960 Alumni fund for funding me.
List of Figures
Figure 1: A diagram of a DSSC showing the reduction and oxidation of the redox couple. First photoexcitation occurs due to the incident photon. Then the electrons are conducted around the circuit to the cathode, where they reduce the redox mediator, which is then oxidised to regenerate the dye.
Figure 2: T2 reduction at the cathode and working electrode. a) Skeletal structures of T2 and T- (Grätzel et al., 2010). b) A diagram of the reduction of T2 at the cathode in a DSSC. c) The setup of the electrolytic cell used to analyse the reduction and oxidation of T2.
Figure 3: Cyclic voltammogram of a 5mm PEDOT electrode in 0.1 mM T2 and 0.1 M TBAPF6 in ACN with a Pt wire counter electrode and a silver wire reference. The peak at 0.362 V was due to the reduction of T2 and the peak at 0.457 V was due to the oxidation of T -.
Figure 4: Cyclic voltammogram obtained in 0.1 mM T2 containing 0.1 M TBAPF6 and ACN, showing the reduction of T2 and the oxidation of T - at the surface of a 2mm radius Pt disk electrode. A silver wire reference electrode was used and the counter electrode was Pt wire. The reduction peak for T2 is at -1.533 V and the corresponding oxidation peak is at -0.750 V.
Figure 5: Cyclic voltammogram of 2mm radius glassy carbon electrode in T2 solution, with a silver wire reference electrode and a Pt wire counter electrode. The reduction peak for T2 shifts from 0.194 V to -0.108 V after 50 potential sweeps, while the oxidation peak due to T-, shifts from 0.636 V to 0.832 V.
Notes
[1] Grace Lowe undertook this research at the end of the first year of her chemistry degree at the University of Nottingham, the third year of which she is due to begin in September 2012
References
Boschloo, G. and A. Hagfeldt (2009), 'Characteristics of the Iodide/Triiodide RedoxMediator in Dye-Sensitized Solar Cells', Accounts of Chemical Research, 42, 1819-26
Boschloo, G., A. Hagfeldt, E. A. Gibson, E. Gabrielsson, L. Sun and S. M. Feldt (2010), 'Design of Organic Dyes and Cobalt Polypyridine Redox Mediators for High-Efficiency Dye-Sensitized Solar Cells', Journal of the American Chemical Society, 132, 16714-24
Department of Energy and Climate Change (2012), 'UK Energy Statistics', available at http://www.decc.gov.uk/assets/decc/11/stats/publications/energy-trends/4821-pn-12-032.pdf, accessed 24 June 2012
Grätzel, M., M. Wang, N. Chamberland, L. Breau, J. E. Moser, R. Humphry-Baker, B. Marsan and S. M. Zakeeruddin (2010), 'An organic redox electrolyte to rival triiodide/iodide in dye-sensitized solar cells', Nature Chemistry, 2, 385-89
Grätzel, M., S. M. Zakeeruddin, B. Marsan, M. K. Nazeeruddin, L. Breau, S. Ahmad, V. Brault and J. Burschka (2011), 'Influence of the counter electrode on the photovoltaic performance of dye-sensitized solar cells using a disulfide/thiolate redox electrolyte', Energy and Environmental Science, 5, 6089-97
Totterdell, I. J., S. A. Spall, C. D. Jones, R. A. Betts and P. M. Cox (2000), 'Acceleration of global warming due to carbon-cycle feedbacks in a coupled climate model', Nature, 408, 184-87
Yang, S., X. Wen and S. Anandan (2005), 'Room temperature growth of CuO nanorod arrays on copper and their application as a cathode in dye-sensitized solar cells', Materials Chemistry and Physics, 93, 35-40
To cite this paper please use the following details: Lowe, G. (2012), 'Development of Platinum-free Dye-sensitized Solar Cells', Reinvention: a Journal of Undergraduate Research, British Conference of Undergraduate Research 2012 Special Issue, www.warwick.ac.uk/go/reinventionjournal/issues/bcur2012specialissue/lowe. Date accessed [insert date]. If you cite this article or use it in any teaching or other related activities please let us know by e-mailing us at Reinventionjournal@warwick.ac.uk.