Keep the Ball! The Value of Ball Possession in Soccer
Eric J. Parziale[1] and Philip A. Yates[2], Department of Mathematics, Saint Michael's College
Abstract
In this study, play-by-play data from a sample of 123 games from the English Premier League's (EPL) 2010-2011 campaign were obtained from the soccer analytic company StatDNA. Team ability to maintain ball possession was measured by the expected probability of ball possession. Multilevel logistic regression – specifically, a model using varying intercept and varying slopes – was used to identify which teams were most successful in terms of ball possession when controlling for various in-game situations. Blinder-Oaxaca decomposition was used to quantify how much the gap in ball possession rates between the top and bottom teams was due to in-game decision making.
Keywords: Statistics, Soccer, Logistic regression, Multilevel analysis, Blinder-Oaxaca decomposition
Introduction
The three biggest tournaments in world soccer are arguably the FIFA World Cup, the UEFA Champions League and the FIFA Women's World Cup. The most recent winners were, respectively, Spain in 2010, Chelsea in 2012 and Japan in 2011. Though comprising some of the smallest and least physical squads in each of their tournaments, these teams still found a way to win at the end of the day. Instead of winning physical battles and out-muscling their opponents, these teams must have relied on some combination of skill and organisation to defeat their opponents.
This leads to the question 'How does one measure a soccer player's skill?'. An ideal study might examine the relative contributions of dribbling and passing ability. However, dribbling ability is inherently difficult to study. Even with the most detailed play-by-play data available there is no way of measuring the speed at which players travel with the ball, how many opponents are beaten by a dribbler, or how frequently a dribbler changes directions.
While dribbling ability is difficult to measure, passing ability is easier to capture and quantify. Rosenfeld (2011) found that passing skill is almost equal across all players and teams in Brazilian Serie A after accounting for pass difficulty. This means that players are undifferentiated in their ability to pass the ball. However, this does not mean that players are undifferentiated in their ability to apply that skill. Even though teams might have similar levels of talent, there might be significant differences in how teams make decisions. Furthermore, this decision-making ability may be highly correlated with winning.
The analysis of ball possession and passing in soccer is a recent phenomenon. Jones et al. (2004) found that successful teams in the English Premier League (EPL) have significantly longer possessions than unsuccessful teams regardless of the score of the match. However, it should be noted that both successful and unsuccessful teams had longer durations of possession when they were losing matches. Oberstone (2009) investigated which pitch actions were associated with the relative success of EPL clubs from match data collected during the 2007-2008 season. Furthermore, Oberstone (2009) found that overall ball possession was one of 13 significant pitch factors that differentiate three tiers of EPL clubs (top four, middle twelve, and bottom four). In a study based on match data from the Spanish Primera División during the 2008-2009 season, Lago-Peñas and Dellal (2010) found, too, that the most successful teams maintained a higher percentage of ball possession and that possession strategies were influenced by situation variables. Even though it was a different league to the one Jones et al. (2004) studied, Lago-Peñas and Dellal (2010) came to a similar finding. Lago-Ballesteros and Lago-Peñas (2010) found that top teams in the Spanish Primera División had a significantly higher ball possession than the middle-tier teams in the league. Even though ball possession was not significant in a discriminant analysis of winning, losing, and tying teams in the Spanish Primera División, Lago-Peñas et al. (2010) found that winning teams had significantly higher assists and crosses completed.
Even more revolutionary in the analysis of ball possession and passing is the work performed by the US-based company StatDNA, headed by Jaeson Rosenfeld. Rather than dealing with match data, as had been done in previous research, StatDNA has worked with play-by-play data from the Brazilian Serie A and the EPL. In working with the play-by-play data from the Brazilian Serie A, Ames (2011) found that in order to create goals, ball possession was less important than completion of difficult passes. Alamar (2011) found that in Brazilian Serie A passes from midfield to the attacking box have the most value in terms of increasing a team's chance of scoring.
The purpose of this article is to measure the relationship between ball possession and winning in the EPL during the 2010-2011 season based on play-by-play data from StatDNA. A multilevel logistic regression model with varying slopes and coefficients will be used to estimate the ball possession rates at a team level after accounting for in-game situations. Finally, a Blinder-Oaxaca decomposition will be used to quantify how much of the gap in ball retention rates between the top and bottom teams in the EPL is due to in-game decision making.
Data and model
The Data
The play-by-play data that were obtained from StatDNA are from a sample of 123 games from the EPL's 2010-2011 season. In the data set, there are 120,302 observations and 428 players. Of particular interest are the in-game factors that will be used in the analysis. For the event factor, a goalie punt is when a goalkeeper distributes the ball by punting it. A goalie throw is when a goalkeeper distributes the ball by throwing it. A clearance and head clearance are when a player clears the ball from danger under pressure. A cross is when a player attempts a cross. A throw in is when the player throws the ball into play. For passes, a pass air is when a player attempts a pass with any body part other than the head and it travelled at some point higher than the shoulder; a pass ground is when a player attempts a pass with any body part other than the head and it did not travel at any point higher than the shoulder; and a pass head is when the pass is attempted with the head (StatDNA, 2011).
The four different types of pressure are challenge, closing, no pressure, and marked. A challenge is when a defensive player is actively reaching the ball or the closest defensive player is making physical contact with the player in possession. Marked is when the nearest defensive player is within 5 yards of the player in possession. Closing is when the nearest defensive player is within 10 yards of the player in possession or within 15 yards if the distance is being closed rapidly. Any pressure less than these definitions is considered no pressure (StatDNA, 2011).
The three different types of body position are front, sideways, and back. Front means simply that the player was facing the goal. Sideways is when the player is side-on to the goal. Back is when the player's back is to the goal (StatDNA, 2011).
The line factor describes where the opponent's defenders are set up between the ball and the goal. 'Line 0' represents when the entire defence is between the ball and the goal. 'Line 1' means that no strikers on the defensive team are behind the ball, while simultaneously a back line is intact and at least one midfielder is between the ball and the goal. 'Line 2' means there is at least one player between the ball and the goal, while simultaneously no more than one line of defenders is between the ball and goal. 'Line 3' represents when the player with the ball is clear through on goal (StatDNA, 2011). Figure 1 gives more clarification with respect to the line factor.
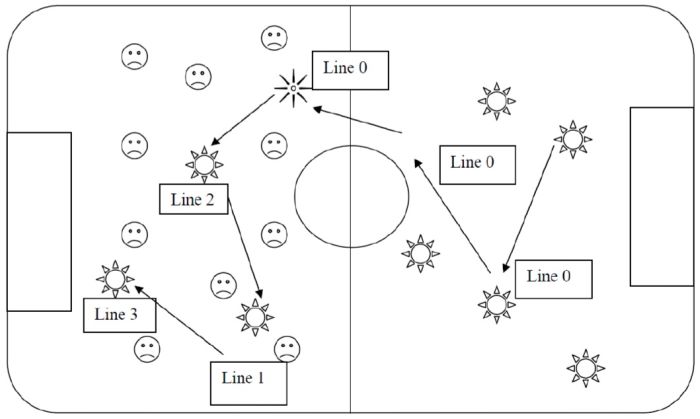
Figure 1: Line types in EPL data set, with sun attacking player (Source: StatDNA, 2011)
The one-touch factor describes if the pass was one-timed or not. The relative frequencies of the event, pressure, body, line, and one-touch factors are summarised in Table 1.
The distance variable simply measures the distance in yards that the pass travelled. Table 2 summarises this variable. From Table 2, the interquartile range (IQR) for passes where ball possession is maintained is 16.47 yards versus 29.64 yards on passes where ball possession is not maintained. Figure 2 shows the relationship between the distance of the pass and whether or not the ball possession was maintained. Shorter passes are more likely to be completed than longer passes.
| Event | Relative Frequency | Retained Ball Possession |
|---|---|---|
| Pass Ground | 0.560 | 0.879 |
| Pass Air | 0.150 | 0.424 |
| Pass Head | 0.092 | 0.492 |
| Clearance | 0.051 | 0.533 |
| Throw in | 0.048 | 0.843 |
| Cross | 0.044 | 0.336 |
| Head Clearance | 0.040 | 0.529 |
| Goalie Throw | 0.009 | 0.974 |
| Goalie Punt | 0.007 | 0.504 |
Table 1(a): Relative frequencies of factors and ball possession rates in EPL data set
| One Timed Pass | Relative Frequency | Retained Ball Possession |
|---|---|---|
| No | 0.796 | 0.745 |
| Yes | 0.204 | 0.605 |
Table 1(b): Relative frequencies of factors and ball possession rates in EPL data set
| Pressure | Relative Frequency | Retained Ball Possession |
|---|---|---|
| Marked | 0.617 | 0.736 |
| No Pressure | 0.147 | 0.705 |
| Closing | 0.122 | 0.797 |
| Challenge | 0.115 | 0.539 |
Table 1(c): Relative frequencies of factors and ball possession rates in EPL data set
| Body Position | Relative Frequency | Retained Ball Possession |
|---|---|---|
| Front | 0.516 | 0.653 |
| Sideways | 0.358 | 0.769 |
| Back | 0.126 | 0.824 |
Table 1(d): Relative frequencies of factors and ball possession rates in EPL data set
| Line | Relative Frequency | Retained Ball Possession |
|---|---|---|
| Line 1 | 0.695 | 0.724 |
| Line 0 | 0.238 | 0.745 |
| Line 2 | 0.066 | 0.529 |
| Line 3 | 0.0002 | 0.263 |
Table 1(e): Relative frequencies of factors and ball possession rates in EPL data set
| Min. | Q1 | Median | Q3 | Max. | Mean | St. Dev. | |
|---|---|---|---|---|---|---|---|
| All Passes | 0.0 | 10.30 | 18.25 | 29.73 | 121.60 | 22.02 | 16.80 |
| Possession Maintained | 0.0 | 10.82 | 17.72 | 27.29 | 121.60 | 20.64 | 14.29 |
| Possession Not Maintained | 0.0 | 8.06 | 20.88 | 37.70 | 121.40 | 25.52 | 21.48 |
Table 2: Summary Statistics: distance (in yards) of pass
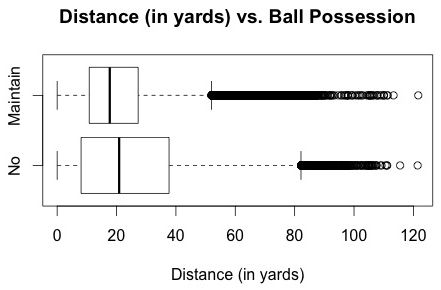
Figure 2: Distance of pass (in yards) versus ball possession
The Model
The model used to estimate the ball possession rates at a team level after accounting for in-game situations is a multilevel logistic regression model where the intercept and slope coefficients are varying for each team. The rationale for using this model is that each team will have its own sets and will vary in their in-game tactics. These sets and tactics may be unique to each team. Hence, the intercept and the coefficients associated with each of the in-game situations should vary for each team. At the play level, the logistic regression is
where πi, i=1,…,120302, is the probability of successful ball possession for play i for team j; αj is the intercept for team j; β1j,…, β8j are the coefficients for event type for team j; β9j, β10j, and β11j are the coefficients for pressure type for team j; β12j and β13j are the coefficients for body position type for team j; β14j, β15j, and β16j are the coefficients for line type for team j; β17j is the coefficient for a one-timed pass for team j; and β18j is the coefficient for distance of pass for team j, where j=1,…, 20.
The second part of the model, and this is what makes it a multilevel model, deals with modeling the team regression coefficients in the logistic regression. The coefficients are modeled as
The prior distributions given to the unexplained team-level errors and provide a range of uncertainty wider than the range of reasonable values for the parameters; therefore, these prior distributions are noninformative. This multilevel model is similar to one used by Alamar and Weinstein-Gould (2008) to estimate the effectiveness of defensive linemen in the National Football League (USA). For a more detailed discussion on assigning prior distributions to the varying intercept-varying slopes model see Gelman and Hill (2007).
Results
Team Model
For the multilevel logistic regression model, 20,000 iterations were used with the first 10,000 iterations used as a burn-in for model convergence. These iterations were performed using OpenBUGS (Lunn et al., 2009). Of particular interest for each team j is the average probability of ball possession for the team. This probability sums the estimated probability of ball possession over the different combination of game factors within each team. These estimated probabilities, calculated using R (R Core Team, 2012), are presented in Table 3 along with the points each team earned during the 2010-2011 EPL campaign.
| Team | 2.5% | 50% | 97.5% | Points 2010-2011 | Tier |
|---|---|---|---|---|---|
| Chelsea | 0.758 | 0.779 | 0.794 | 71 | 1 |
| Manchester United | 0.762 | 0.771 | 0.781 | 80 | 1 |
| Arsenal | 0.761 | 0.771 | 0.780 | 68 | 1 |
| Manchester City | 0.758 | 0.768 | 0.777 | 71 | 1 |
| Tottenham | 0.727 | 0.738 | 0.748 | 62 | 2 |
| WBA | 0.727 | 0.736 | 0.745 | 47 | 2 |
| Liverpool | 0.718 | 0.728 | 0.738 | 58 | 2 |
| Wigan Athletic | 0.702 | 0.711 | 0.720 | 42 | 2 |
| Blackpool | 0.695 | 0.704 | 0.716 | 39 | 3 |
| Fulham | 0.689 | 0.701 | 0.713 | 49 | 2 |
| West Ham Utd | 0.690 | 0.701 | 0.712 | 33 | 3 |
| Newcastle | 0.682 | 0.694 | 0.704 | 46 | 2 |
| Everton | 0.679 | 0.690 | 0.701 | 54 | 2 |
| Aston Villa | 0.675 | 0.687 | 0.699 | 48 | 2 |
| Sunderland | 0.676 | 0.687 | 0.698 | 47 | 2 |
| Wolves | 0.673 | 0.684 | 0.694 | 40 | 3 |
| Birmingham | 0.666 | 0.677 | 0.689 | 39 | 3 |
| Bolton | 0.629 | 0.641 | 0.653 | 46 | 2 |
| Blackburn | 0.623 | 0.634 | 0.644 | 43 | 2 |
| Stoke City | 0.561 | 0.576 | 0.590 | 46 | 2 |
Table 3: Estimated probability of ball possession for 2010-2011 EPL Teams
One thing that stands out in Table 3 is the relationship between total team points and expected ball possession rate. By Oberstone's (2009) definition, the EPL is divided into three tiers. The top four teams are the first tier while the bottom four teams are the third tier and the rest make up the second tier of teams. The top-tier teams during the 2010-2011 season happen to be the top teams in ball possession rate adjusted for in-game factors. Figure 3 graphically illustrates this separation of the top tier from the rest of the pack.
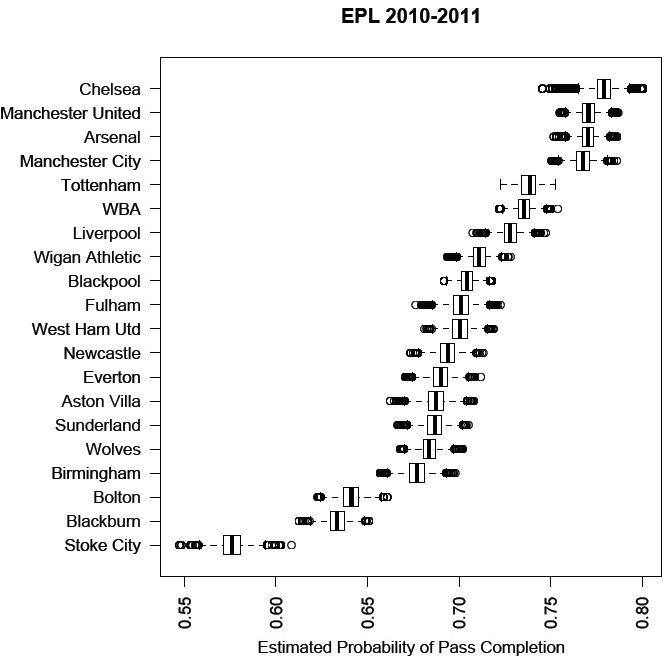
Figure 3: Boxplots of estimated probability of ball possession for 2010-2011 EPL season
Figure 4 illustrates the relationship between the median estimated probability of ball possession versus a team's points earned. The Spearman correlation coefficient for these two variables is 0.666. A polynomial regression model of team points earned on the median estimated probability of ball possession produced an adjusted R-squared value of 0.739. Although there is a slight negative association between the two variables when the probability of ball possession is in the high 50% to low 60%, there is a moderately strong positive association between the estimated median probability of ball possession and a team's point earned once the probability of ball possession is greater than 64%.
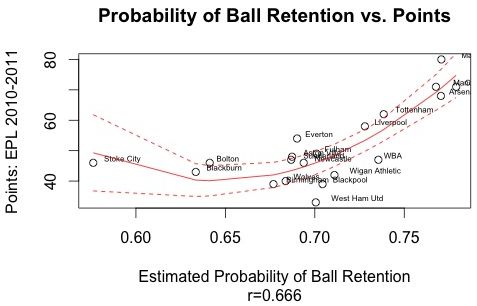
Figure 4: Plot of median estimated probability of ball possession versus 2010-2011 points with 95% confidence band from polynomial regression
Further Analysis
The question remains as to what are the underlying factors leading to the top four teams in the EPL also having the best ball possession rates. Some soccer analysts would argue that when a team feels overmatched (perhaps in terms of talent), the weaker team would favour a defensive strategy of sitting back and defending with all 11 players behind the ball. As such, these analysts would argue that top teams have higher rates of possession because they are allowed to possess the ball uncontested in their own defensive third of the field (at line 0 or line 1). This warrants an investigation of how the estimated ball possession rates for each team from the multilevel logistic regression differ across the different types of defensive sets (Line 0, Line 1, and Line 2). Table 4 shows how the estimated probability of ball possession differs across the defensive sets adjusted for in-game factors. There is no discernible pattern between the top four teams and the rest of the league in terms of ball possession rates across defensive sets. This means that the higher rates of possession found with top teams are not due to their opponent's tactics. That is, high rates of possession are not due to weak teams sitting back and allowing top teams to complete passes.
| Team | Overall | Line 0 | Line 1 | Line 2 |
|---|---|---|---|---|
| Chelsea | 0.779 | 0.777 | 0.716 | 0.580 |
| Manchester United | 0.771 | 0.789 | 0.730 | 0.556 |
| Arsenal | 0.771 | 0.775 | 0.786 | 0.570 |
| Manchester City | 0.768 | 0.780 | 0.735 | 0.537 |
| Tottenham | 0.739 | 0.778 | 0.729 | 0.561 |
| WBA | 0.736 | 0.773 | 0.726 | 0.574 |
| Liverpool | 0.728 | 0.817 | 0.732 | 0.550 |
| Wigan Athletic | 0.711 | 0.770 | 0.722 | 0.557 |
| Blackpool | 0.704 | 0.802 | 0.719 | 0.584 |
| Fulham | 0.701 | 0.780 | 0.739 | 0.623 |
| West Ham Utd | 0.701 | 0.791 | 0.727 | 0.545 |
| Newcastle | 0.694 | 0.785 | 0.733 | 0.545 |
| Everton | 0.690 | 0.795 | 0.738 | 0.585 |
| Aston Villa | 0.687 | 0.820 | 0.741 | 0.555 |
| Sunderland | 0.687 | 0.792 | 0.726 | 0.561 |
| Wolves | 0.684 | 0.793 | 0.723 | 0.571 |
| Birmingham | 0.677 | 0.788 | 0.737 | 0.600 |
| Bolton | 0.641 | 0.765 | 0.739 | 0.575 |
| Blackburn | 0.634 | 0.834 | 0.722 | 0.570 |
| Stoke City | 0.576 | 0.781 | 0.735 | 0.544 |
Table 4: Estimated median probability of ball possession for 2010-2011 EPL teams
Another possible explanation for why larger ball possession rates are found among the top four EPL teams is that these teams make better on-field decisions. In other words, these teams may be attempting smarter passes, both by type and distance of pass. Table 5 lists the relative frequencies of the different pass types for the 120,302 observations in the data set for each team. A Pearson chi-squared test was run to test whether the distribution of event types were similar for each team. The conclusion is that the distribution of pass types does significantly differ between teams (X2=4365.743, df=152, p-value < 2.2 x 10⁻¹⁶). Figure 5 summarises the Pearson residuals from the test in a mosaic plot. The blue rectangles indicate the events that teams had more than what would be expected; the red rectangles indicate the events that teams had less than what would be expected. Air, ground, and head passes were the most frequently occurring events in the data set. From Table 1, ground passes were the best passes to make in terms of retaining possession. While all of the teams did attempt more ground passes than any other event in the data set, the top four teams, Arsenal, Chelsea, Manchester City, and Manchester United, all attempted a significantly greater number of ground passes than might be expected. Meanwhile, lower-tier teams Aston Villa, Birmingham, Blackburn, Bolton, Newcastle, Stoke City, Sunderland, and Wolves attempted a significantly lower number of ground passes that might be expected. Air passes were one of the worst passes to make in terms of ball possession. Birmingham, Blackburn, Blackpool, Bolton, Newcastle, and Stoke City attempted a significantly greater number of air passes than would be expected; Arsenal, Chelsea, Manchester City, and Manchester United attempted a significantly lower number of air passes than would be expected. The top four teams seem to be choosing passes that have a high likelihood of allowing them to keep the ball.
| Team | Plays | Clearance | Cross | Goalie Punt | Goalie Throw | Head Clearance | Pass Air | Pass Ground | Pass Head | Throw in |
|---|---|---|---|---|---|---|---|---|---|---|
| Arsenal | 6290 | 0.04 | 0.03 | 0.01 | 0.01 | 0.03 | 0.10 | 0.67 | 0.07 | 0.04 |
| Aston Villa | 4737 | 0.05 | 0.06 | 0.01 | 0.01 | 0.04 | 0.16 | 0.51 | 0.12 | 0.05 |
| Birmingham | 4711 | 0.06 | 0.04 | 0.01 | 0.01 | 0.05 | 0.18 | 0.48 | 0.12 | 0.05 |
| Blackburn | 5644 | 0.07 | 0.05 | 0.01 | 0.01 | 0.06 | 0.18 | 0.43 | 0.13 | 0.06 |
| Blackpool | 7388 | 0.05 | 0.04 | 0.01 | 0.01 | 0.03 | 0.18 | 0.54 | 0.09 | 0.05 |
| Bolton | 4688 | 0.06 | 0.05 | 0.01 | 0.01 | 0.05 | 0.18 | 0.44 | 0.14 | 0.06 |
| Chelsea | 13391 | 0.03 | 0.04 | 0.01 | 0.01 | 0.03 | 0.11 | 0.67 | 0.06 | 0.04 |
| Everton | 5146 | 0.05 | 0.04 | 0.00 | 0.01 | 0.03 | 0.15 | 0.56 | 0.10 | 0.05 |
| Fulham | 4474 | 0.06 | 0.04 | 0.01 | 0.01 | 0.04 | 0.16 | 0.55 | 0.10 | 0.05 |
| Liverpool | 5703 | 0.04 | 0.04 | 0.01 | 0.01 | 0.04 | 0.14 | 0.60 | 0.08 | 0.05 |
| Manchester City | 7249 | 0.04 | 0.04 | 0.00 | 0.01 | 0.04 | 0.11 | 0.66 | 0.06 | 0.04 |
| Manchester United | 5973 | 0.04 | 0.04 | 0.00 | 0.01 | 0.04 | 0.12 | 0.66 | 0.06 | 0.03 |
| Newcastle | 5338 | 0.06 | 0.05 | 0.00 | 0.01 | 0.04 | 0.18 | 0.52 | 0.09 | 0.05 |
| Stoke City | 4243 | 0.08 | 0.05 | 0.02 | 0.00 | 0.06 | 0.21 | 0.35 | 0.18 | 0.07 |
| Sunderland | 5739 | 0.06 | 0.04 | 0.01 | 0.00 | 0.04 | 0.17 | 0.51 | 0.11 | 0.05 |
| Tottenham | 5543 | 0.05 | 0.04 | 0.00 | 0.01 | 0.05 | 0.14 | 0.57 | 0.08 | 0.04 |
| WBA | 6251 | 0.06 | 0.04 | 0.01 | 0.01 | 0.04 | 0.15 | 0.58 | 0.07 | 0.05 |
| West Ham Utd | 5338 | 0.07 | 0.04 | 0.01 | 0.01 | 0.05 | 0.16 | 0.52 | 0.10 | 0.05 |
| Wigan Athletic | 7130 | 0.06 | 0.03 | 0.01 | 0.01 | 0.05 | 0.15 | 0.58 | 0.07 | 0.05 |
| Wolves | 5376 | 0.05 | 0.07 | 0.01 | 0.01 | 0.04 | 0.17 | 0.50 | 0.11 | 0.06 |
Table 5: Relative frequencies of event type by team
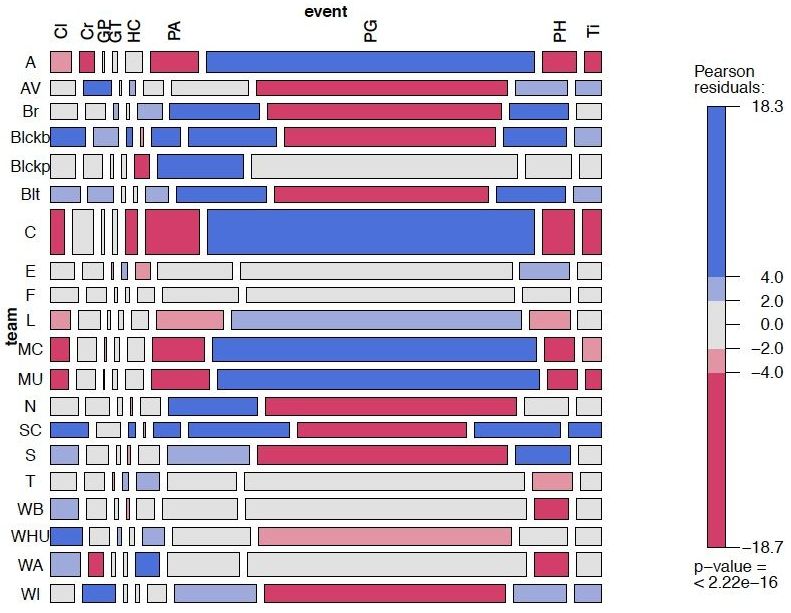
Figure 5: Mosaic plot of Pearson residuals of events By team
Furthermore, Table 6 shows the median distance of the pass event in yards for each team. A Kruskal-Wallis test (p-value < 2.2 x 10⁻¹⁶) leads to the conclusion that the location parameters of the actual distance of the pass (in yards) for each team significantly differed. Post hoc tests were performed in a manner similar to Kutner et al. (2005). Let and be the average of the ranks of the pass events and ni and nj be the number of pass events for teams i and j, respectively. Let g=20(19)/2=190 be the number of pairwise comparisons to be made. Then the 100(1-α)% simultaneous confidence interval for the difference in average ranks between team i and j is
for i=1,…,20, j=1,…, 20, and i≠j. At the familywise error rate of α=0.05, there are some significant differences involving pass distances and the top four teams in the EPL. Arsenal attempted significantly shorter passes than all of the teams except for Sunderland, Newcastle, Wolves, and Everton. Chelsea attempted significantly longer passes than Arsenal and significantly shorter passes than Blackpool, WBA, and Stoke City. Manchester City attempted significantly longer passes than Arsenal and significantly shorter passes than Blackpool, WBA, and Stoke City. Manchester United attempted significantly longer passes than Arsenal and Sunderland while attempting significantly shorter passes than Blackpool, WBA, and Stoke City. This means that top teams are generally choosing to play shorter passes than less-successful teams. Taking into account that shorter passes are more strongly associated with maintaining possession, it appears that top teams are intentionally making decisions that have high probabilities of maintaining possession.
| Team | Distance | Team | Distance |
|---|---|---|---|
| Arsenal | 17.088 | Fulham | 18.385 |
| Sunderland | 17.117 | Wigan Athletic | 18.385 |
| Newcastle | 17.692 | Bolton | 18.439 |
| Wolves | 17.720 | West Ham Utd | 18.601 |
| Everton | 17.889 | Aston Villa | 18.868 |
| Chelsea | 18.028 | Birmingham | 18.868 |
| Manchester City | 18.028 | Blackburn | 18.974 |
| Tottenham | 18.111 | Blackpool | 19.235 |
| Manchester United | 18.248 | WBA | 19.416 |
| Liverpool | 18.358 | Stoke City | 19.723 |
Table 6: Median distance of pass event (in yards) for each team
Blinder-Oaxaca Decomposition
The question still remains as to how much impact the choice of passes has on ball possession rates for the top four teams, Chelsea, Manchester United, Arsenal and Manchester City, versus the other 16 teams. Is the difference actually due to the decision-making on the field or due to some non-measureable characteristic, like the team's talent? The Blinder-Oaxaca decomposition technique (Blinder, 1973; Oaxaca, 1973) has often been used in economics literature to decompose group differences in a response, typically wages, based on separate contributions of measurable and non-measurable characteristics. Fairlie (2005) extended these results to logic and profit models. Fairlie's technique will be applied to the play-by-play data from the EPL 2010-2011 season since the multilevel model was based on a logit model.
In order to measure the gap in ball possession rates between the top four teams versus the bottom 16 teams, a logit model is fit for each of three samples: a sample consisting of all the plays made by the top four teams, a sample consisting of all the plays made by the bottom 16 teams, and a pooled sample using all of the teams. Predicted probabilities of ball possession are calculated for each of the two groups using each of the three logit models.
Identifying the group differences in ball possession rates based on the various in-game variables is not as straightforward. Ideally, the number of plays for the top teams, say nT, would equal the number of plays for the bottom teams, nB, thus creating a one-to-one match of observations from the two groups; however, nT=32903 and nB=87399. To create the one-to-one match, order the predicted probabilities of ball possession for the top four teams from lowest to highest. Randomly select nT plays from the bottom 16 sample and order that sample's predicted probabilities of ball possession from lowest to highest. These ordered samples are matched by each group's rankings in terms of predicted probability of ball possession. In this analysis, 1000 randomly selected subsamples of the bottom 16 teams' plays are used.
Calculating the gap in ball possession is as follows. For each match of a subsample of the bottom 16 teams' plays to the top four teams' plays, the ball possession gap attributed to the j-th game characteristic of interest is:
where xT represents a game characteristic from the top four teams, xB represents a game characteristic from the bottom 16 teams' subsample, and F(•) is the cumulative distribution function of a logistic distribution. The final estimate of the gap in ball possession between the two groups that is attributed to a certain game characteristic is the mean of the 's calculated from the 1000 randomly selected subsamples.
For standard error calculations, Fairlie (2005) uses a delta method argument. For each match of a subsample of the bottom 16 teams' plays to the top four teams' plays, the approximate variance of is
where
and f(•) is the probability density function of a logistic distribution.
Table 7 shows the results of the non-linear decomposition technique to identify the causes of this gap in ball possession rates between the top four and the bottom 16 teams. The top 4 teams retained the ball on 78.0% of the plays in the data set while the bottom 16 teams retained the ball on 69.2% of plays in the data set, resulting in a ball possession gap of 8.8%. The type of pass decision event, which can be thought of as a stand-in for decision making, accounts for 0.0599 to 0.0608 (68.4% to 69.4%) of the ball possession rate gap. The player's body position accounts for 0.0053 to 0.0075 (6.1% to 8.5%) of the ball possession rate gap. The type of pressure a player is facing on the play accounts for 0.0030 to 0.0054 (3.4% to 6.3%) of the ball possession rate gap. The decompositions reveal that group differences in all of the included in-game characteristics explain 79.6% to 85.4% of the top four/bottom 16 ball possession gap. That is, 79.6% to 85.4% of the difference in ball possession rates between top and bottom teams can be attributed to the chosen method of ball distribution in a given situation. The percentage of the gap left unexplained might be due to non-measurable characteristics like a team's level of talent.
| Specification | |||
|---|---|---|---|
| Sample used for coefficients | Top 4 | Bottom 16 | Pooled |
| n – Sample Size | 32903 | 87399 | 120302 |
| Top 4 ball possession rate | 0.780 | 0.780 | 0.780 |
| Bottom 16 ball possession rate | 0.692 | 0.692 | 0.692 |
| Top 4/Bottom 16 Gap | 0.088 | 0.088 | 0.088 |
| Contribution from group differences in: | |||
| Event type Std. Error % of Gap |
0.061 (0.0010) 69.4% |
0.060 (0.0006) 68.4% |
0.061 (0.0005) 69.3% |
| Pressure type Std. Error % of Gap |
0.005 (0.0010) 6.3% |
0.003 (0.0005) 3.4% |
0.003 (0.0004) 3.8% |
| Body Position Std. Error % of Gap |
0.008 (0.0008) 8.5% |
0.005 (0.0003) 6.1% |
0.006 (0.0002) 6.5% |
| Line Type Std. Error % of Gap |
0.002 (0.0002) 1.8% |
0.001 (0.0001) 1.4% |
0.002 (0.0001) 1.7% |
| One Touch Pass Std. Error % of Gap |
-0.0004 (0.0002) -0.5% |
-0.001 (0.0001) -0.8% |
-0.001 (0.0001) -0.6% |
| Distance of Pass Std. Error % of Gap |
-0.0001 (0.0002) -0.1% |
0.001 (0.0001) 1.1% |
0.001 (0.0001) 0.8% |
| All Included Variables % of Gap |
0.075 85.4% |
0.070 79.6% |
0.071 81.5% |
Table 7: Non-linear decomposition of top 4/bottom 16 gaps in ball possession rates
Summary and conclusions
For the analysis of the play-by-play data from the EPL 2010-2011 season, pass completion was treated as a substitute for ball possession. Various in-game factors do have an impact on whether or not a pass was completed. Certain types of passes (goalie throws, ground passes, throw ins, and head clearances) and pressure (closing, marked, and no pressure) all lead to higher ball possession rates.
When ball possession is calculated after adjusting for the various in-game factors, there is a significant positive relationship between ball possession and team's winning percentage in the EPL once the probability of ball possession is greater than 64% (p-value of linear term < 0.0001 and p-value of quadratic term 0.0002 from a polynomial regression). Although Rosenfeld (2011) showed that teams and players in Brazil Serie A are undifferentiated in their ability to complete a pass, the results presented here indicate that one can differentiate the top tier of the EPL from the rest of the league by analysing their pass decisions. It should be noted that Rosenfeld's (2011) definition of a pass differed from the definition presented here. He only studied passes on the ground, air, and head passes. All of these passes are ones that a player intends to complete, as opposed to a clearance. Therefore it makes sense that the difficulty of a pass completely determines a player's pass completion percentage (Rosenfeld, 2011). The results presented here were able to capture the passing alternatives, i.e. the clearances, punts, etc. By looking at the same in-game factors as Rosenfeld (2011) along with the additional passing alternatives, a significant relationship between ball possession and winning was revealed. A direct conclusion from the Blinder-Oaxaca decomposition is that a player's skill at choosing what type of pass to make in a given situation is a key determinant of a team's ability to win.
In summary, teams in the EPL are significantly differentiated by their expected rate of ball possession. Ball possession rate is strongly correlated with points earned during the EPL regular season. Lastly, 79.6% to 85.4% of the difference in ball retention rates between the top tier and the rest of the league is due to the type of passes the teams choose to attempt.
List of figures
Figure 1: Line types in EPL data set, with sun attacking player (Source: StatDNA, 2011).
Figure 2: Distance of pass (in yards) versus ball possession
Figure 3: Boxplots of estimated probability of ball possession for 2010-2011 EPL season
Figure 4: Plot of median estimated probability of ball possession versus 2010-2011 points with 95% confidence band from polynomial regression
Figure 5: Mosaic plot of Pearson residuals of events by team
List of tables
Table 1: Relative frequencies of factors and ball possession rates in EPL data
Table 2: Summary statistics: distance (in yards) of pass
Table 3: Estimated probability of ball possession for 2010-2011 EPL teams
Table 4: Estimated median probability of ball possession for 2010-2011 EPL teams
Table 5: Relative frequencies of event type by team
Table 6: Median distance of pass event (in yards) for each team
Table 7: Non-Linear decomposition of top 4/bottom 16 gaps in ball possession rate
Notes
[1] Eric Parziale is a senior Mathematics Major and Music minor at Saint Michael's College. He is Co-President of the Saint Michael's College chapter of Pi Mu Epsilon (a National Mathematics Honor Society), a member of Phi Beta Kappa, and a player on the College's Tennis and Soccer teams. In College athletics, Eric has been selected to the NE-10 Academic All-Conference team, and the NE-10 Commissioner's Honor Roll. After College he plans to work in New York City as a software developer.
[2] Philip Yates is an Assistant Professor of Mathematics at Saint Michael's College, located in Colchester, Vermont. He received a B.S. in Mathematical Sciences from DePaul University, M.S. in biostatistics from the University of Vermont, and Ph.D in statistics from the University of South Carolina. His areas of expertise include applied statistical techniques for environmental sciences, biostatistics, and sports. He is a member of the American Statistical Association, Mathematical Association of America, and the Society for American Baseball Research.
References
Alamar, B. (2011), How we measure pass value creation: advancing the ball, available at http://blog.statdna.com/post/2011/06/01/How-we-measure-pass-value-creation-advancing-the-ball.aspx, accessed 27 July 2011
Alamar, B. and J. Weinstein-Gould (2008), 'Isolating the effect of individual linemen on the passing game in the National Football League', Journal of Quantitative Analysis in Sports, 4 (2), available at http://www.degruyter.com/abstract/j/jqas.2008.4.2/jqas.2008.4.2.1113/jqas.2008.4.2.1113.xml?rskey=ttp7eR&result=1&q=Alamar, accessed 14 June 2011
Ames, J. (2011), Why pass completion % in attacking 1/3 is misleading, available at http://blog.statdna.com/post/2011/03/09/Why-pass-completion-in-attacking-13-is-a-misleading-statistic.aspx, accessed 27 July 2011
Blinder, A. S. (1973), 'Wage discrimination: Reduced form and structural variables', Journal of Human Resources, 8, 436-55
Fairlie, R. W. (2005), 'An extension of the Blinder-Oaxaca decomposition technique to logit and probit models', Journal of Economic and Social Measurement, 30, 305-16
Gelman, A. and J. Hill (2007), Data Analysis Using Regression and Multilevel/Hierarchical Models, New York, NY: Cambridge University Press
Jones, P. D., N. James and S. D. Mellalieu (2004), 'Possession as a performance indicator in soccer', International Journal of Performance Analysis in Sport, 4, 98-102
Kutner, M. H., C. J. Nachtsheim, J. Neter and W. Li (2005), Applied Linear Statistical Models, 5th edition, Boston, MA: McGraw-Hill
Lago-Ballesteros, J. and C. Lago-Peñas (2010), 'Performance in team sports: Identifying the keys to success in soccer', Journal of Human Kinetics, 25, 85-91
Lago-Peñas, C. and A. Dellal (2010), 'Ball possession strategies in elite soccer according to the evolution of the match-score: The influence of situational variables', Journal of Human Kinetics, 25, 93-100
Lago-Peñas, C., J. Lago-Ballesteros, A. Dellal and M. Gómez (2010), 'Game-related statistics that discriminated winning, drawing and losing teams from the Spanish soccer league', Journal of Sports Science and Medicine, 9, 288-93
Lunn, D., D. Spiegelhalter, A. Thomas, and N. Best (2009), 'The BUGS project: Evolution, critique, and future directions', Statistics in Medicine, 28, 3049-67
Oaxaca, R. (1973), 'Male-female wage differentials in urban labor markets', International Economic Review, 14, 693-709
Oberstone, J. (2009), 'Differentiating the top English Premier League football clubs from the rest of the pack: Identifying the keys to success', Journal of Quantitative Analysis in Sports, 5 (3), available at http://www.degruyter.com/view/j/jqas.2009.5.3/jqas.2009.5.3.1183/jqas.2009.5.3.1183.xml?format=INT, accessed 27 July 2011
R Core Team (2012), R: A Language and Environment for Statistical Computing, Vienna, Austria: R Foundation for Statistical Computing
Rosenfeld, J. (2011), Why players, teams are undifferentiated on "passing skill", available at http://blog.statdna.com/post/2011/05/04/-Differentiation-in-passing-skill-between-players-and-teams-is-non-existent.aspx, accessed 19 July 2011
StatDNA (2011), Data Dictionary for Raw CSVs + Calculated Fields, available at http://www.statdna.com, accessed 11 May 2011
To cite this paper please use the following details: Parziale, E. J., Yates, P. A. (2013), 'Keep the Ball! The Value of Ball Possession in Soccer,' Reinvention: an International Journal of Undergraduate Research, Volume 6, Issue 1, www.warwick.ac.uk/reinventionjournal/issues/volume6issue1/parzialeandyates Date accessed [insert date]. If you cite this article or use it in any teaching or other related activities please let us know by e-mailing us at Reinventionjournal at warwick dot ac dot uk.