
Health Needs Assessment
To inform the University's work towards the Thrive at Work CommitmentLink opens in a new window and to ascertain where more support may be required, we asked staff to complete a Health Needs Assessment Survey. The survey included questions covering a number of wellbeing issues, organised under the categories:
- Food and nutrition.
- Smoking.
- Physical activity.
- Alcohol.
- How you feel emotionally.
- Sleep.
- Workplace culture.
- Workplace illness.
- Health and wellbeing support.
- Supplementary questions for line managers.
- About you.
Managers were asked to encourage staff members to complete the survey, and paper versions were available for staff that don’t regularly have access to a computers.
Results
The 2019 survey was launched in February 2019 and remained open for one month.
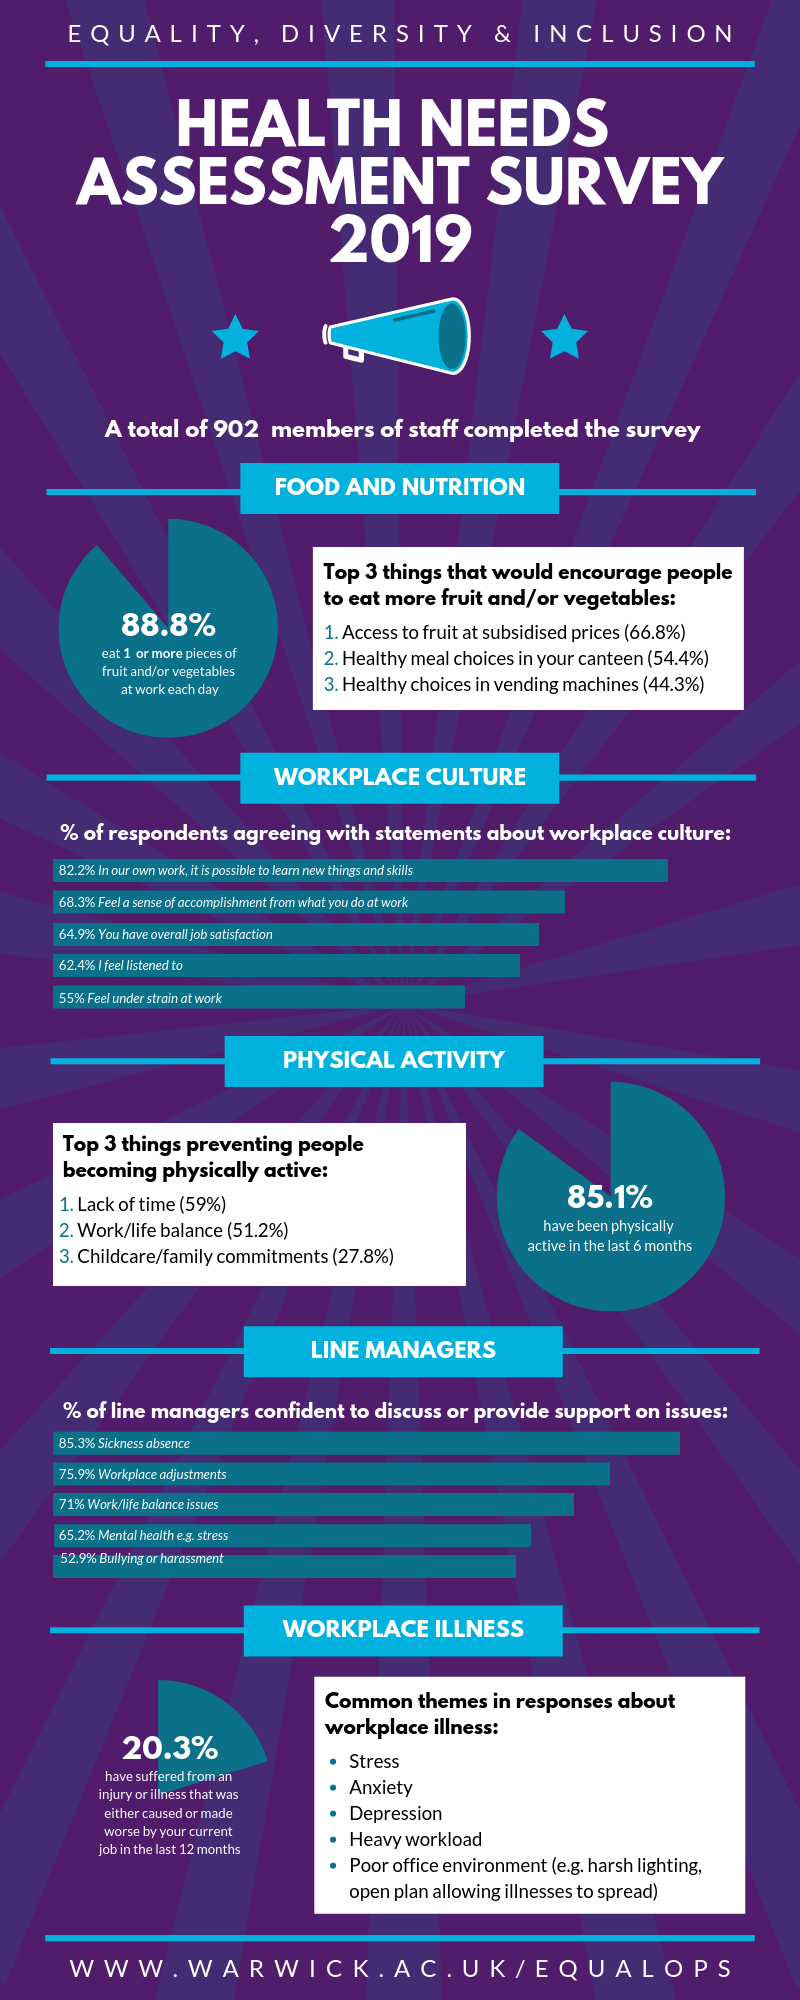
In total, 902 people completed the survey. 54.1% of respondents said that in general their health is ‘good’ (16.94% said their health is ‘very good’).
You can also see results visually represented in the results infographic below, and download a copy of the infographic posterLink opens in a new window and digital screen slidesLink opens in a new window to display in your department and share with colleagues.
Food and Nutrition
10% of respondents eat 5 or more pieces of fruit and/or vegetables each day (including outside of work).
88.8% of respondents said that they eat 1 or more pieces of fruit and/or veg at work each day.
When asked what would encourage them to eat more fruit and/or vegetables, the top three most common responses were (respondents could select more than one option):
- Access to fruit at subsidised prices (66.83% of respondents selected this answer).
- Healthy meal choices in your canteen (54.36% of respondents).
- Healthy choices in vending machines (44.31% of respondents).
Smoking
82.3% of respondents said that they don’t smoke. 37.14% of respondents said that they intend to give up smoking.
When asked what support would be most helpful for quitting smoking, the top three most common responses were (respondents could select more than one option):
- Other (please specify) (35.61% of respondents selected this answer) – common themes in written responses include motivation/willpower, deciding to give up, having children or becoming pregnant.
- Support from family/friends (29.55% of respondents).
- Nicotine replacement therapy/e-cigarettes (25.76% of respondents).
Physical Activity
85.1% of respondents said that they have been physically active in the last 6 months.
10.05% of respondents who said they weren’t physically active in the last 6 months, said that they plan to become physically active in the next 6 months.
When asked what prevents them from being more physically active, the top three most common responses were (respondents could select more than one option):
- Lack of time (59% of respondents selected this answer).
- Work/life balance (51.2% of respondents).
- Childcare/family commitments (27.8% of respondents).
When asked what would encourage them to become more physically active, the top three most common responses were (respondents could select more than one option):
- Flexible working hours to allow physical activities before/after work (54.75% of respondents selected this answer).
- Company subsidised membership to local gyms (48.73% of respondents).
- Free health and fitness assessments (45.78% of respondents).
Alcohol
NHS alcohol consumption guidelines recommend drinking no more than 14 units a week on a regular basis, spreading drinking over 3 or more days if you regularly drink as much as 14 units per week.
78.95% of respondents said that they have a drink containing alcohol fewer than 4 times a week, and 12.77% never have a drink containing alcohol.
85.07% of respondents said that they drink 4 or fewer units of alcohol on a typical day when they are drinking, 14.92% said that they drink 5 or more units on a typical day when they are drinking.
How You Feel Emotionally
When asked “Overall, how satisfied are you with life in general?” 5.5% of respondents said that they are ‘Completely satisfied’, and 2.2% of respondents said they are ‘Not at all satisfied’.
When asked “Overall, to what extent do you feel the things you do in life are worthwhile?” 10.89% of respondents answered ‘Completely worthwhile’, and 1.59% answered ‘Not at all worthwhile’.
Sleep
81.9% of respondents said that in the last month their sleep has troubled them in some way (39.61% ‘A little’, 29.04% ‘Quite a bit’, and 13.24% ‘Very much’).
16.37% of respondents had a problem with their sleep 7 nights a week.
Workplace Culture
Thinking about the workplace environment, respondents were asked if the agree or disagree with a range of statements (they were also given the option to respond ‘Don’t know’), including:
- Feel optimistic about your future with your current employer (53.29% of respondents agreed with this statement).
- Feel under strain at work (54.99% of respondents agreed).
- Feel a sense of accomplishment from what you do at work (68.32% of respondents agreed).
- You have overall job satisfaction (64.93% of respondents agreed).
- I can use personal initiative or judgement (87.94% of respondents agreed).
- I feel listened to (62.39% of respondents agreed).
- People are open to sharing ideas (75.06% of respondents agreed).
- There is good cooperation between colleagues (72.69% of respondents agreed).
- I can have 1:1 meetings with my manager (89.30% of respondents agreed).
- In our own work, it is possible to learn new things and skills (82.23% of respondents agreed).
Workplace illness
20.3% of respondents said that they have suffered from an injury or illness that was either caused or made worse by your current job in the last 12 months.
Those who responded that they had suffered from an injury or illness that was caused or made worse by work were offered an opportunity to provide more information. Common themes among responses were:
- Stress.
- Anxiety.
- Depression.
- Heavy workloads.
- Poor office environment (e.g. open plan format is leading to illnesses like colds being spread, harsh lighting is causing eye irritation).
80.07% have gone to work despite feeling that they should have taken the day off sick in the last 12 months.
Supplementary questions for line managers
69.10% of respondents said that they have no line management responsibility.
Thinking about discussing and/or providing support and guidance, respondents with line management responsibility were asked how confident they feel with a range of issues (they were given the options ‘Very confident’, ‘Quite confident’, ‘Neither confident nor unconfident’, ‘Not so confident’ and ‘Not confident at all’), including:
- Sickness absence (85.3% of respondents said that they are confident i.e. either very or quite confident).
- Return to work interviews (73.44% of respondents said that they are confident).
- Workplace adjustments (75.94% of respondents).
- Having difficult conversations (68.88% of respondents).
- Bullying or harassment (62.92% of respondents).
- Physical activity (45% of respondents).
- Healthy eating (47.28% of respondents).
- Mental health e.g. stress (65.15% of respondents).
- Stopping smoking (51.07% of respondents).
- Alcohol consumption (24.59% of respondents).
- Sleep (37.08% of respondents).
- Work/life balance issues (71.01% of respondents).
About you
The Equality Monitoring Annual ReportLink opens in a new window is produced by the ED&I team and reviewed by the Equality and Diversity Committee. It provides data on staff and students in relation to the following protected characteristics: gender, disability, ethnicity, age, sexual orientation, and religion and belief. As such the data presented in the Equality Monitoring Annual Report provide a useful comparison between the demographics of the general staff population and those of the respondents to the Health Needs Assessment Survey.
Gender of respondents to the Survey:
- 35% of respondents said that they would describe themselves as female.
- 25% said they identify as male.
- 4% said that they do not identify as male, female.
The 2017/18 Equality Monitoring Annual Report shows that 53.2% of Warwick staff are female and 46.8% are male (data on non-binary identities are not available).
Age of respondents to the Survey:
- 13% of respondents indicated that they are aged under 20.
- 25% are aged 21 – 30.
- 1% are aged 31 – 40.
- 83% are aged 41 – 50.
- 49% are aged 51 - 60, 5.21% aged 60+.
The 2017/18 Equality Monitoring Annual Report shows that the majority of Warwick staff are aged 25 - 55 (25.6% aged 25 - 35, 26.7% aged 36 - 45, 25.1% aged 46 - 55).
Working hours of respondents to the Survey:
- 08% of respondents indicated that they work full time.
- 03% work part time.
- 89% are casual.
The 2017/18 Equality Monitoring Annual Report shows that 79.9% of staff work full time (20.1% work part time).
Infographic of Results
You can also download a copy of the infographic poster and digital screen slidesLink opens in a new window to display in your department and share with colleagues.
![]()
You may also be interested in: