Use of Multidimensional Gas Chromatography Techniques to Detect Illegal Doping with Beta-2 Agonists
by Eamon McGuire[1] and Philip J. Marriott[2], School of Chemistry, Monash University
Abstract
Beta-2 agonists have been misused in both farming and sport over the last few decades (Pinheiro et al., 2009: 910; Maquirriain, 2010: 2) and have the potential not only to impact on the integrity of sporting competitions, but also potentially to harm consumers. There has been a large amount of research which focused on detecting these and similar compounds in doping situations (Van Eenoo and Delbeke, 2010). This study aimed to develop a preliminary method of separating beta-2 agonists from a urine sample, which could be used as a starting point for more complete identification, through multidimensional gas chromatography (MDGC), a technique which had not been applied to this class of drugs previously. Detection limits for three beta-2 agonists, clenbuterol, salbutamol and terbutaline, were determined using MDGC and a Flame Ionisation Detector (FID), with concentrations of 4.49 μg/mL, 2.53 μg/mL and 4.09 μg/mL respectively being determined as the limits of detection. While this is not as low as is possible using a GC-MS instrument, this technique showed great potential for separating these drugs from the urine matrix and, if coupled to a more sensitive detector such as a Mass Spectrometer (MS), is expected to deliver much greater sensitivity and certainty of identification than traditional GC techniques.
Keywords: Beta-2 agonist, comprehensive gas chromatography, doping control, GC×GC, World Anti-Doping Agency
Introduction
Competitive sport has been around for thousands of years and there is evidence to suggest that for a large amount of that time there have been athletes who have been looking to gain an advantage over their competitors by taking drugs (Bowers, 1997: 1299). The most common methods which are thought of when sports doping is mentioned include steroids, erythropoietin (EPO) and, more recently, peptides and blood doping. One class of drug which is not commonly thought of when sports doping is mentioned is beta-2 agonists, however the World Anti-Doping Agency (WADA) prohibited list states that 'all beta-2 agonists… are prohibited' except under certain medical conditions (WADA, 2013a: 4). This class of drug has been on the WADA banned list for over a decade and, in that time, has been in the top 6 most detected doping techniques in terms of the number of Adverse Analytical Findings (AAFs) attributed to it (Van Eenoo and Delbeke, 2010: 239).
Beta-2 agonists are generally used to treat respiratory illnesses such as asthma in humans and Chronic Obstructive Pulmonary Disease (COPD) in livestock and racing animals, as well as humans. It is a class of drug which includes salbutamol, which is marketed under the trade name Ventolin, as well as other common asthma medications such as terbutaline and salmeterol (Collomp et al., 2010: 283). Clenbuterol is another member of this class, which is no longer used as an asthma treatment due to potentially harmful side effects. However clenbuterol has been implicated in several high-profile farm and sports doping cases previously, as it is believed to have anabolic effects if taken at high doses (Guddat et al., 2012: 534; Zaccardi, 2012).
Beta-2 agonists are structural analogues of adrenaline (epinephrine) and act in a similar but more selective manner, as they are essentially synthetic attempts to replicate some of the modes of action of adrenaline in the body (Kuiper et al., 1997: 195). Figure 1 and table 1 show the general structure of a beta-2 agonist and adrenaline. Beta-2 agonists act on the beta-2 adrenergic receptors in the body, which has several desirable effects, such as relaxing of the smooth muscles of the airways, which allows for easier breathing in patients suffering from asthma, as well as some potentially lethal side effects such as increased heart rate and tremors, although these are associated with stimulation of the beta-1 receptors, rather than the desired beta-2 stimulation (Van Eenoo and Delbeke, 2010: 229, 237). They are also thought to have anabolic properties if taken at higher than prescribed doses and, as such, are banned for use by athletes unless it can be proven that they have a medical condition which requires their use (Polettini, 1996: 28).
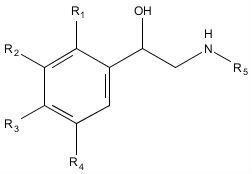
Figure 1: General structure of a beta-2 agonist. Table 1 below lists the side (R) groups for each of the drugs used in this experiment, as well as adrenaline, on which their structures are based.
| Drug name | R1 | R2 | R3 | R4 | R5 |
|---|---|---|---|---|---|
| Adrenaline (epinephrine) | H | H | OH | OH | CH3 |
| Clenbuterol | H | Cl | NH2 | Cl | tert-butyl |
| Salbutamol | H | CH2OH | OH | H | tert-butyl |
| Salmeterol | H | H | OH | CH2OH | C5H10OC4H8Ph |
| Terbutaline | H | OH | H | OH | tert-butyl |
Table 1: R groups for beta-2 agonists used in this experiment, as well as adrenaline (epinephrine), the compound on which they are based.
Another illegal use for beta-2 agonists is in the farming industry, as they have been shown to repartition energy stores in cattle from fat to lean muscle (Strydom et al., 2009: 557). This essentially leads to animals which become heavier much faster, consuming less feed and thus saving farmers money on the feed, while increasing profits when the animals are sold. Beta-2 agonists increased in popularity after steroids were banned by the European Union (EU) in the mid-1980s, as they were shown to have many similar effects, however they can have potentially dangerous side effects if accidentally ingested by humans through meat (Kuiper et al., 1997: 195). As such, they are now banned for growth promotion purposes throughout most of Europe, Asia and Australia, although the USA and some South American countries have two products which are licensed for this use (Delmore et al., 2010: 2825). Therefore the need to be able to detect low concentrations of beta-2 agonists in a variety of matrices is not only a problem associated with the integrity of sport, but also potentially affects the health of the meat eating public.
Gas chromatography (GC) is an analytical technique which has been around for several decades and can be used to detect volatile substances in a variety of mixtures. The compounds in the mixture are heated up and vaporised, before passing through a column which is also heated by the instrument oven. The stationary phase of the column separates the components depending on their properties such as polarity, boiling point and chirality. Multidimensional GC (MDGC) is a more recent technique which involves a second column being coupled to the first either by a switching device which cuts out a section of the original chromatogram to be analysed on the second column, or by a modulation device which traps a small segment of the first dimension (1D) effluent before releasing it into the second dimension (2D) column and trapping the next segment. A system such as this is known as a comprehensive GC system or simply GC×GC.
The modulation device used in this experiment was a Longitudinally Modulated Cryogenic System (LMCS), which has a moving trap cooled by liquid carbon dioxide. The trap cools a section of the column, before moving up and releasing that section on to the short 2D column, moving back down and trapping the next section of the 1D effluent. This movement is analogous to an injection into the first dimension and compresses the peaks into much shorter, sharper peaks, which improves sensitivity, as well as providing more separation due to the second column (Mitrevski et al., 2010: 128). The data is then converted into a 2D plot, which shows the 1D and 2D retention times (1tR and 2tR respectively) of each of the components in the mixture. The time between each of the movements of the modulator is known as the modulation period (PM) and is one of the modulation factors which has to be optimised when conducting a GC×GC experiment, as well as the modulation temperature (TM), which has to be carefully chosen in order to maximise the trapping of the effluent from the first column. Figure 2 shows the basic setup for a GC×GC system.
The techniques which are most commonly used to detect beta-2 agonists are GC-MS and liquid chromatography (LC-MS) (Van Eenoo and Delbeke, 2010: 241). Both of these techniques have been shown to have acceptably low detection limits according to the WADA guidelines; however they rely on knowing the compounds for which the analyst is looking and setting the detector to be 'blind' to the matrix (Mitrevski et al., 2010: 128). The advantage which GC×GC offers is that it can potentially separate compounds completely from a sample matrix, which allows for full mass spectra of each of the components to be obtained and a more complete representation of what is present in a sample found.
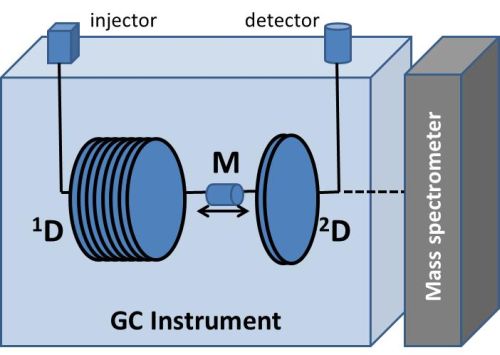
Figure 2: Schematic of the GC×GC instrument. M is the modulation device. For the present work, an FID was used, but mass spectrometry offers better sensitivity and specificity.
This study aimed to develop a preliminary method of separating beta-2 agonists from a urine matrix in order to potentially lower detection limits for this class of drug. GC×GC has previously been shown to separate anabolic steroids, which are chromatographically similar to beta-2 agonists, from a urine matrix (Mitrevski et al., 2010) and, as such, it was hoped that a similar result could be obtained for beta-2 agonists. Although the detector being used was a Flame Ionisation Detector (FID) rather than a more sensitive and specific detector such as a Mass Spectrometer (MS) which has been previously used, if the technique was shown to separate the compounds of interest completely from the sample matrix then it could be reasonably assumed that more complete mass spectra of the compounds could be obtained, which would lead to lower detection limits.
Materials, equipment and methods
The three beta-2 agonists used in this exercise were clenbuterol, salbutamol and terbutaline and were provided as a gift by Dr John Vine from Racing Analytical Services Limited (RASL). The instrument used was an Agilent 7890A GC-FID, with a 7683B autosampler, retrofitted with an LMCS modulation device. All solvents used were GC grade and all other chemicals were purchased from Sigma Aldrich. The GC columns used in this experiment were a VF200ms, DB-5MS UI and DB1701, purchased from Agilent Technologies, as well as an Rxi-17Sil, purchased from Restek Corp.
Although several different combinations of columns were tested, in the end the column set which was chosen for construction of the calibration curve was a 30 m non-polar 5% phenyl DB-5MS UI 1D (0.25 mm internal diameter, 0.25 μm film thickness) and a 2 m mid-polar trifluoropropyl VF200ms 2D (0.15 mm ID, 0.15 μm film). The other columns mentioned above were tested as 2D columns in experiments not described here; however, the separation of the components was not as complete, as well as there being a large amount of 2D tailing, so this column set was chosen for all experiments regarding the calibration curve.
The GC conditions for all GC×GC experiments were as follows: the inlet was held at 300°C, the FID was held at 280°C with a data acquisition rate of 100Hz. The oven was initially held at 100°C for 30 s, increased at 20°C/min for 4 min up to 180°C, slowed to 3°C/min up to 200°C and then increased back to 20°C/min up to 320°C, where it was held for 2 min. The LMCS modulator was programmed to come on at 6 min into the run and switch off at 17.5 min into the run. Experiments which are not described here were carried out and the optimum PM was found to be 5 s and TM 40°C. Splitless injections were made.
Each of the compounds was made up to a standard concentration of 200 μg/mL in methanol and refrigerated when not in use. Prior to injection into the instrument, the compounds were derivatised according to a previously described method, which is required in order to increase their volatility and lower their polarity (Caban et al., 2011: 8116). In short, this method involved drying 100 μL of the compounds under a stream of nitrogen, before dissolving them in 70 μL of N, O-bis(trimethylsilyl)trifluoroacetamide (BSTFA) with a catalytic amount of trimethylchlorosilane (TMCS) and 30 μL of ethyl acetate before heating them to 60°C for one hour.
For the urine analysis, the drugs were spiked into a blank urine sample at concentrations of 0, 2, 5, 10 and 20 μg/mL, as well as 25 μg/mL of caffeine and 20 μg/mL of methyltestosterone as internal standards and extracted according to a previously described process, which involved making the samples alkaline (pH> 9), before liquid-liquid extraction (LLE) using diethyl ether (Van Eenoo and Delbeke, 2010: 240). The organic layer was then collected and treated in the same manner as the methanol standards previously, in that it was refrigerated when not in use and derivatised as described prior to analysis.
Results and discussion
There are two measurements which can be used in constructing a calibration curve in an experiment such as this; total peak area and signal to noise ratio (S/N). The first measurement only takes into account the peak area of the compound, without factoring in any interference which may have been caused by either the electronic noise caused by the instrument or the chemical noise caused by the matrix from which the compound is being separated. Although the chemical noise is generally much lower in GC×GC experiments due to the improved separation offered by the second dimension, the electronic noise is generally higher due to the increased data acquisition rates which are required. S/N measurements factor this in and, rather than simply measuring the response of a certain compound, compare this response to the background noise surrounding the peak. These ratios are generally much higher for GC×GC experiments than single dimension GC due to the almost complete separation offered by the second dimension.
Table 2 shows the total peak areas for each of the drugs at each of the concentrations, while figure 3 represents these results graphically. The %RSD statistic is a representation of how much of the mean peak area can be accounted for by the standard deviation. For example, a %RSD of 50% would mean that the standard deviation is half the magnitude of the mean and there is too much variation between the data points to consider the data precise. A %RSD value of under 5% is generally considered acceptable in a practical sense, although this number is not an absolute maximum value and values up to 10% are often considered to still be acceptable, particularly when dealing with low concentrations such as those which are seen in this experiment.
| Concentration | CL (av. area, %RSD) | SB (av. area, %RSD) | TB (av. area, %RSD) |
|---|---|---|---|
| 2 µg/mL | 145, 1.26% | 41.7, 0.379% | 47.0, 5.53% |
| 5 µg/mL | 107, 0.745% | 55.0, 1.75% | 62.2, 1.04% |
| 10 µg/mL | 230, 0.0438% | 85.8, 1.80% | 130, 0.389% |
| 20 µg/mL | 548 2.07% | 126, 5.18% | 223, 0.125% |
Table 2: The average peak areas and relative standard deviations for each of the beta-2 agonists used. The highlighted point for clenbuterol was not used in the calibration curve for reasons discussed below.
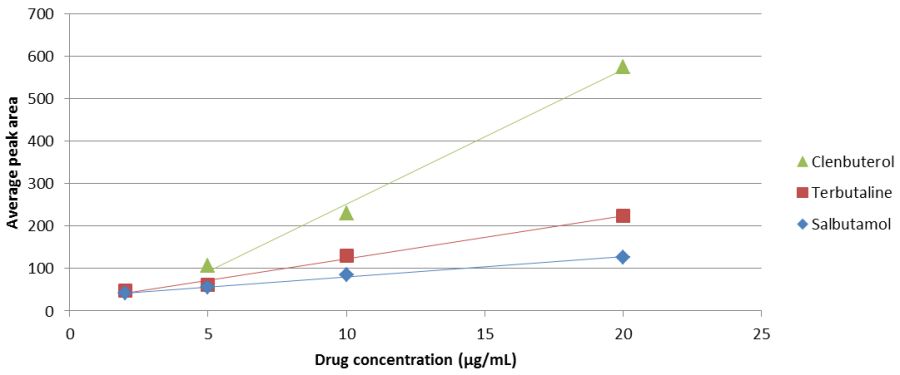
Figure 3: The calibration curve for each of the beta-2 agonists in urine
Figure 3 shows that each of the drugs produces a trend line which is linear over the concentrations measured. Table 3 has the equations and coefficients of determination (R2 values) for each of these lines, which is essentially a measurement of how well each of the points is fitted to the trend line. For these measurements, anything over 0.98 is considered acceptable, while anything over 0.99, as all of these lines are, means that the trend line fits almost exactly to the points plotted. This means that the points show a very high level of correlation to the trend line obtained.
The point of 2 μg/mL for clenbuterol was not included in the calculations for the trend line, or in any further calculations, due to the fact that it was in fact higher than the measured response at 5 μg/mL. Further calculations showed that, by including both of these points in the construction of the calibration curve or by including only the point at 2 μg/mL in the curve, the R2 value for the clenbuterol trend line dropped significantly. The point was also further than three standard deviations away from the expected result following the trend line obtained from using only the highest three concentrations and, as such, was considered an outlier and not used in any further measurements or discussions of the results.
| Trend line equation for concentration vs. average peak area | R2value | |
|---|---|---|
| Clenbuterol (3 points only) | y= 31.695x - 66.03 | 0.9941 |
| Salbutamol | y= 4.6993x + 33.538 | 0.9910 |
| Terbutaline | y= 10.131x + 21.913 | 0.9907 |
Table 3: Trend line equations and R2 values for each of the beta-2 agonists used to construct the calibration curves in figure 3
While these results show that the relationship between the peak area and the concentration of the drugs is linear over the concentrations measured, they do not factor in how much of these signals may have been due to background interference or noise. As mentioned previously S/N ratios provide a measurement of this and table 4 shows the S/N values for each of the points measured, while figure 4 represents this graphically.
| S/N at 2 µg/mL (%RSD) | S/N at 5 µg/mL (%RSD) | S/N at 10 µg/mL (%RSD) | S/N at 20 µg/mL (%RSD) | |
|---|---|---|---|---|
| Clenbuterol | 5.847 (1.64%) | 4.536 (0.249%) | 9.886 (0.0429%) | 26.10 (5.39%) |
| Salbutamol | 2.258 (0.877%) | 3.127 (0.950%) | 5.167 (0.0684%) | 7.495 (1.16%) |
| Terbutaline | 2.593 (1.28%) | 4.338 (0.782%) | 7.892 (2.68x10⁻³%) | 13.40 (2.79%) |
Table 4: Mean signal to noise ratios for each of the drugs at the measured concentrations
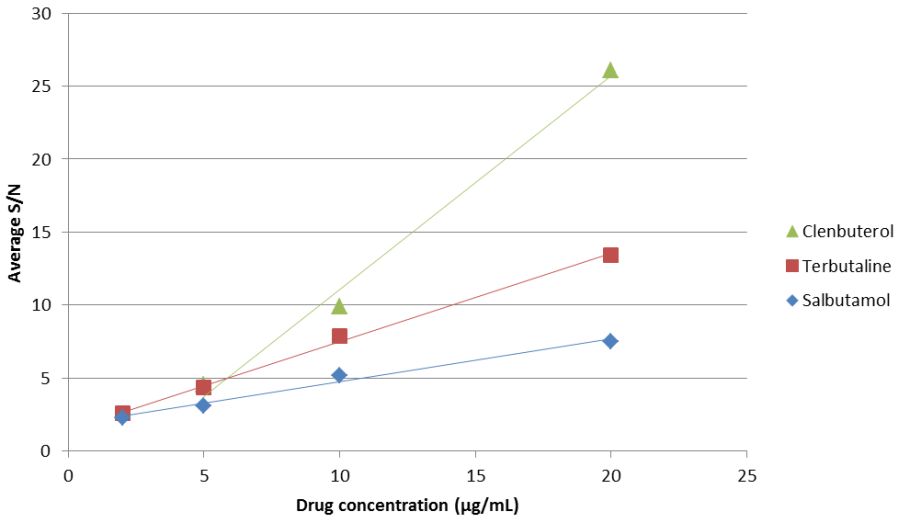
Figure 4: Average S/N ratios for each of the drugs across the concentration range measured
Again, the %RSD values for all of these points show that there is a high level of precision associated with them, which shows that the results are highly reproducible across runs. An S/N value of 3 is the level below which data is considered unreliable and so, by using the trend lines obtained in figure 3, the concentration at which each of these drugs would reach an S/N value of 3 can be calculated. Table 5 shows both these equations and the values at which the S/N ratios are 3.
| Trend line equation for S/N (fig 3) | R2 value | Conc. where S/N=3 | |
|---|---|---|---|
| Clenbuterol (3 points only) | y = 1.4641x - 3.5725 | 0.9914 | 4.49 µg/mL |
| Salbutamol | y = 0.6034x + 1.4734 | 0.9971 | 2.53 µg/mL |
| Terbutaline | y = 0.2934x + 1.7979 | 0.9845 | 4.09 µg/mL |
Table 5: Trend line equations and R2 values for each of the lines in figure 4, as well as the lowest concentrations which could be expected to have an acceptable S/N ratio
Table 5 shows that for salbutamol and terbutaline the concentrations with an acceptable S/N value are both below the WADA limits of detection for this class of drugs, which is 20 μg/mL (WADA, 2013b: 2). However, clenbuterol is classed differently from the other members of this class and, as such, must be detected at 2 μg/mL in order for a laboratory to obtain WADA certification (WADA, 2013b: 2).
These results do however show that, even with an FID, which is not as sensitive or specific as an MS detector, the limits of detection are much lower for a GC×GC experiment than a traditional GC experiment. Even when run at the highest concentration used here (20 μg/mL), the beta-2 agonist peaks were almost indistinguishable from the matrix in a 1D GC-FID experiment. Although the chromatogram is not shown here, the S/N values for these runs was only slightly above 1, which is much too low for the signal to be considered accurate. This means that the signal from the compound of interest is almost impossible to determine due to the background interference. Figure 5 shows the 2D plot of the 5 μg/mL sample and shows that the peaks for each of the compounds of interest, as well as the internal standards which were added, can easily be distinguished from the matrix, which means that if an MS were used as the detector, not only would the detection limits be much lower, there would also be the possibility of recording full mass spectra for each of the compounds, which allows for much more comprehensive analysis of a sample and more likelihood of being able to detect any unusual compounds in a sample, such as beta-2 agonists or other illegal drugs.
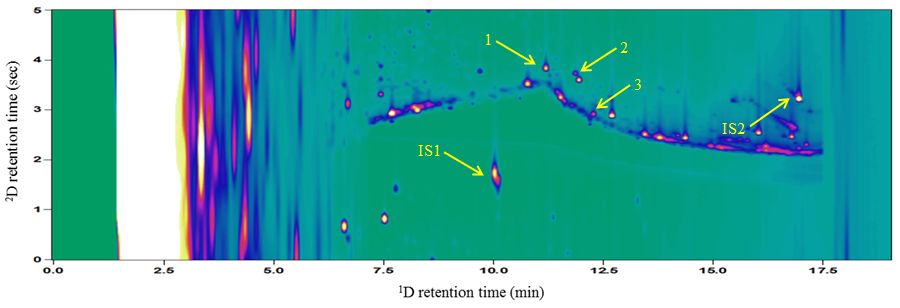
Figure 5: The 2D plot of a 5 µg/mL spiked urine sample. The labelled peaks are terbutaline (1), clenbuterol (2), salbutamol (3), caffeine (IS1) and methyltestosterone (IS2)
This complete separation from the matrix in the second dimension is important because it allows for more accurate identification of compounds of interest, as well as potential storage of data until a later date, which could potentially lead to retrospective analysis and catching of drug cheats from past samples, without having to store and reanalyse the sample. Current testing methods rely on target tests for compounds of interest, which may overlook other performance-enhancing or illegal drugs which may be present. By allowing for full mass spectra of the entire mixture to be obtained, every compound could be analysed, rather than only specific drugs which would be looked for in a standard drug testing run.
Conclusions and future work
This research showed that beta-2 agonists could be separated completely from a urine sample using GC×GC technology and detected at levels much lower than could possibly be detected with a single GC column and similar detector. The limits of detection, which was defined as the concentration where the S/N is equal to 3, for clenbuterol, salbutamol and terbutaline were 4.49 μg/mL, 2.53 μg/mL and 4.09 μg/mL respectively. Although these levels are not lower than what can be obtained with a GC-MS instrument, they were shown to be much lower than what is possible with a single dimension GC-FID and, if an MS were used as the detector, it could be reasonably assumed that the detection levels would significantly drop. Any future work for the development of GC×GC analysis of beta-2 agonists could use an MS detector to optimise sensitivity, while still maintaining the superior separation which can be obtained through GC×GC.
Acknowledgements
The authors thank Dr Blagoj Mitrevski and Dr Sung Tong Chin, for their expert advice and assistance with aspects of instrumental analysis, as well as Dr John Vine for providing the drugs which were used in the research.
List of figures
Figure 1: General structure of beta-2 agonist
Figure 2: Schematic diagram of a GC×GC instrument
Figure 3: Calibration curve of beta-2 agonists in spiked urine
Figure 4: Average S/N ratios for beta-2 agonists in spiked urine
Figure 5: 2D plot of 5 μg/mL spiked urine sample
List of tables
Table 1: R groups for beta-2 agonists used in this experiment and adrenaline
Table 2: Average peak areas and %RSD for beta-2 agonists in spiked urine
Table 3: Trend line equations and R2 values for beta-2 agonists in spiked urine
Table 4: Mean S/N ratios for beta-2 agonists in spiked urine
Table 5: Trend line equations and R2 values for S/N plot and concentration where S/N is equal to 3
Notes
[1] Eamon McGuire is a Bachelor of Arts/Bachelor of Science student who recently completed his honours year in chemistry at Monash University. This project was presented as a poster at both the 20th annual RACI Research and Development Conference in December 2012 and the 1st Monash-Warwick alliance International Conference for Undergraduate Research in May 2013, where it was awarded runner-up for best poster.
[2] Philip Marriott is a Professor in the School of Chemistry, Faculty of Science, Monash University. He undertook postdoc research at the University of Bristol, then commenced his academic career at National University of Singapore. His main research activities are in Analytical Chemistry, specifically gas chromatography (multidimensional GC and comprehensive 2D GC) with mass spectrometry. He has almost 300 refereed International publications, book chapters and patents and has collaborated with researchers from all around the globe.
References
Bowers, L. D. (1997), 'Analytical advances in detection of performance enhancing compounds', Clinical Chemistry, 43 (7), 1299-1304
Caban, M., P. Stepnowski, M. Kwiatkowski, N. Migowska and J. Kumirska (2011), 'Determination of β-blockers and β-agonists using gas chromatography-mass spectrometry - A comparative study of the derivatization step', Journal of Chromatography A, 1218 (44), 8110-22
Collomp, K., B. Le Panse, R. Candau, A.-M. Lecoq and J. De Ceaurriz (2010), 'Beta-2 agonists and exercise performance in humans', Science & Sports, 25 (6), 281-90
Damasceno, L., R. Ventura, J.Ortuño and J. Segura (2000), 'Derivatization procedures for the detection of β2-agonists by gas chromatographic/mass spectrometric analysis', Journal of Mass Spectrometry, 35 (11), 1285-94
Delmore, R. J., J. M. Hodgen and B. J. Johnson (2010), 'Perspectives on the application of zilpaterol hydrochloride in the United States beef industry', Journal of Animal Science, 88 (8), 2825-28
Guddat, S., G. Fußhöller, H. Geyer, A. Thomas, H. Braun, N. Haenelt, A. Schwenke, C. Klose, M. Thevis and W. Schänzer (2012), 'Clenbuterol - regional food contamination a possible source for inadvertent doping in sports', Drug Testing and Analysis, 4 (6) 534-38
Kuiper, H. A., M. Y. Noordam, M. M. H. van Dooren-Flipsen, R. Schilt and A. H. Roos (1998), 'Illegal use of beta-adrenergic agonists: European Community', Journal of Animal Science, 76 (1) 195-207
Maquirriain, J. (2010), 'Epidemiological analysis of doping offences in the professional tennis circuit', Journal of Occupational Medicine and Toxicology, 5 (1), Article 30
Mitrevski, B. S., P. Wilairat and P. J. Marriott (2010), 'Comprehensive two-dimensional gas chromatography improves separation and identification of anabolic agents in doping control', Journal of Chromatography A, 1217 (1), 127-35
Pinheiro, I., B. Jesuino, J. Barbosa, H. Ferreira, F. Ramos, J. Matos and M. I. N. da Silveira (2009), 'Clenbuterol storage stability in the bovine urine and liver samples used for European official control in the Azores Islands (Portugal)', Journal of Agricultural Food Chemistry, 57 (3), 910-14
Polettini, A. (1996), 'Bioanalysis of β2-agonists by hyphenated chromatographic and mass spectroscopic techniques', Journal of Chromatography B, 687 (1), 27-42
Strydom, P. E., L. Frylinck, J. L. Montgomery and M. F. Smith (2009), 'The comparison of three β-agonists for growth performance, carcass characteristics and meat quality of feedlot cattle', Meat Science, 81 (3), 557-64
Van Eenoo, P. and F. T. Delbeke (2010), 'β-Adrenergic Stimulation', in Thieme, D. and P. Hemmersbach (eds), Doping in Sports, Berlin: Springer-Verlag Press, pp. 227-49
WADA (2013a), 'The 2013 Prohibited List International Standard', World Anti-Doping Agency: Montreal, Canada, 2013, available at http://www.wada-ama.org/en/World-Anti-Doping-Program/Sports-and-Anti-Doping-Organizations/International-Standards/Prohibited-List/, accessed 10 August 2012
WADA (2013b), 'Technical Document TD2013MRPL: Minimum Required Performance Levels for Detection and Identification of Non-Threshold Substances', World Anti-Doping Agency: Montreal, Canada, 2013, available at http://www.wada-ama.org/en/Science-Medicine/Anti-Doping-Laboratories/Technical-Documents/, accessed 11 August 2012
Zaccardi, N. (2012), 'American Olympic hopeful Jessica Hardy is peerless in the pool', Sports Illustrated, 9 May 2012, available at http://sportsillustrated.cnn.com/2012/writers/nick_zaccardi/05/09/jessica-hardy-swimming-london-olympics/index.html, accessed 15 August 2012
To cite this paper please use the following details: McGuire, E and Marriott, P.J. (2013), 'Use of Multidimensional Gas Chromatography Techniques to Detect Illegal Doping with Beta-2 Agonists', Reinvention: an International Journal of Undergraduate Research, BCUR/ICUR 2013 Special Issue, http://www.warwick.ac.uk/reinventionjournal/issues/bcur2013specialissue/mcguire/. Date accessed [insert date]. If you cite this article or use it in any teaching or other related activities please let us know by e-mailing us at Reinventionjournal at warwick dot ac dot uk.