The Investigation of Interaction between Heart and Respiration Dynamics for Various Respiration Frequencies
Sean Perry[1], School of Engineering, University of Warwick
Abstract
Interactions exist between numerous physiological processes within humans as systems couple to complete specific bodily functions. Those hardest to understand are often autonomous in nature, such as respiration and heart dynamics. One particular phenomenon, phase synchronisation, has been intensively studied in the literature. This research aimed to instigate phase-locking synchronisation phenomena in 11 healthy volunteers. Due to the fact that autonomous respiration can be 'overruled' and controlled by an individual, this is the parameter which was easily altered.
Drawing on relevant literature to determine the frequencies of respiration desired for testing, the main focus of this research was to have volunteers breathe less than, equal to and slightly above the frequency of baseline heart rate. It was predicted that the heart rate would only raise enough to equal the higher frequency value, and thus lock. Volunteers were asked to follow the particular frequencies of respiration for 100 cycles. The experimental procedure was rigorously planned out and tested prior to beginning recordings on volunteers. The existence of phase-locking synchronisation was observed in ten of the eleven volunteers. The strength and duration of synchronisation episodes were measured.
Keywords: Synchronisation, phase-locking, respiration, heart-rate frequency.
Introduction
Within living organisms, a number of oscillatory processes must take place in order for the organism to function correctly (Glass, 1988). One such process of particular significance is the cardiorespiratory system, responsible for the transport of oxygenated blood around the body, as well as the removal of waste gases upon the blood's return to the lungs (Saladin, 2012). Although it seems apparent that the two systems of respiration and cardiac cycles are interlinked, an understanding of their complete relationship does not yet exist.
Following a number of studies in recent decades, mostly on animals such as dogs and rats (McClintock, 2003; Sheikh-Zade, 1987), it has been suggested that a synchronisation phenomenon exists between the frequency of breathing and subsequent heart rate. Much work has been completed in this field on humans also (Potyagailo, 2003; Pokrovskii, 2002). Potyagailo and Pokrovskii, along with others, worked together on research which utilised a flashing light to trigger frequency of respiration. A flashing light was controlled by an operator while an electrocardiogram (ECG) and pnuemogram recorded vitals. The flashing started at a frequency 5% below baseline heart rate, and measurements were taken for 30-60 seconds. After this period, participants were allowed to recover fully to resting values of respiration and heart rate, before the frequency of flashing increased by 5%. This continued until synchronisation was detected, and this frequency was recorded as the minimum value for cardiorespiratory synchronisation (CRS) to occur. Increase in flashing continued until synchronisation was no longer detected. This value was then considered the upper bound of CRS.
In this way, a range of frequency of respiration over which synchronisation occurs could be found. One such set of experiments was used to detect synchronisation in children (Potyagailo, 2003), another to see how synchronisation range changes with age, testing 5–65 year olds (Pokrovskii, 2002). It is noted that, using this method of steady increase of respiration frequency, no unpleasant sensations were felt by the participants (Pokrovskii, 2002). One such experiment related the outcome of detection of synchronisation to the temperament of the individual, i.e. stressed (Potyagailo, 2003). Being stressed or suffering from a disease was found to reduce the adaptive potential of the body's systems. Another of their experiments utilising flashing lights found that both the upper and lower limits of synchronisation decrease with age (Pokrovskii, 2002).
The aim of this research project is to investigate the phase-locking phenomenon between respiration and heart rate for frequencies of respiration equal to and greater than baseline heart rate. This phenomenon has not been recorded for extended periods in supine subjects at frequencies of respiration exceeding baseline heart rate before (though Pokrovskii is known to have observed phase-locking for short windows).
Van der Pol theory
The van der Pol theoretical model is well established as a means to model the cardiorespiratory system. First derived by Balthasar van der Pol and published in his 1928 paper (van der Pol, 1928), these differential equations are used to map oscillatory processes, especially those with a chaotic element.
The model proposed by Schafer et al. illustrates phase-locking by considering a periodically driven van der Pol oscillator, including an element of noise (Schafer, 1999):
where corresponds to ECG signal (a measure of heart rate),
is the natural frequency of the system (
);
;
and
are the amplitude and frequency of the driving force, respiration for this system, and
is the Gaussian delta-correlated noise function (noise is inherent in the cardiorespiratory system as other processes affect the signals measured here). This is a complete model, and considers external factors which may lead to phase slips in the data (an additional or missing cycle of an oscillator, resulting in an incorrect value of phase, out by 2π (Schafer, 1999)) where spikes appear in result analysis anywhere a phase slip occurs (Pikrovsky, 2001).
For analysis purposes, the phase of the two signals must be determined and compared. To determine the phase of the ECG signal, R-R peaks must be considered. The R peak of an ECG is the highest peak measured, as seen in Figure 1. The period of a single heartbeat will be the time between two of these peaks. Between each R-R interval, the phase of the system increases by 2π.
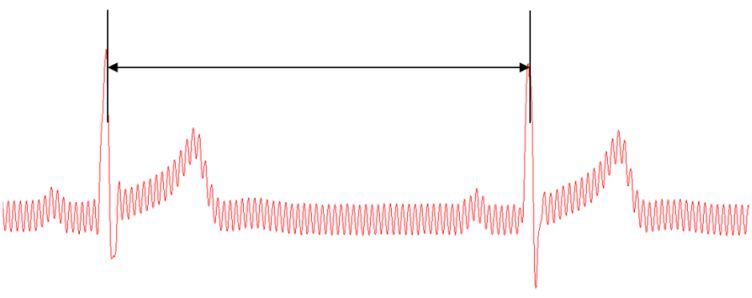
Figure 1: R-R interval in ECG signal (screenshot from recording software).
The time at which these events occur can be considered tk where k=1,2,3...n. Therefore the phase at a given time can be assigned as:
Linear interpolation can then be used to determine an average phase for the system.
A model such as this would allow for peaks to be extracted (Pikrovsky, 2001).
Respiration is a much smoother signal than ECG, and resembles a sine wave when modelled. Considered a narrow-band signal (frequency response considered flat, greatly simplifying analysis), an analytic concept was introduced by Gabor for obtaining the phase (Gabor, 1946).
This uses a Hilbert transform (a linear operator which transforms a time-signal function to a time-signal function with the same domain, by shifting the phase by ±90), where SH(t) is the Hilbert transform of s(t). A(t) and ϕ(t) only have meaning if s(t) is a narrow-band signal; therefore this equation is appropriate for modelling respiration (Pikrovsky, 2001). Peak extraction of this manner was utilised in experiments detailed in Schafer (1998) and Schafer (1999).
Following on from the peak extraction and calculation of phase for the two signals, the relationship must be determined. For this a phase difference between heart rate and respiration is considered. The generalised phase difference ϕn,m is as follows:
where n and m are integers describing the locking ratio and ϕ1,2 are the phases of the two oscillators (Schafer, 1999). Due to the nature of strong noise causing phase slips, as mentioned previously, a cyclic relative phase formula is useful instead:
The cyclic relative formula identifies the preferred stable state ϕ0 (Tass, 1998) understood statistically as the appearance of a peak in the distribution of the cyclic relative phase in Eq. 6 (Prokhorov, 2003). In order to detect synchronisation, a computational model known as a cardiorespiratory synchrogram is used (Schafer, 1999). A synchrogram is constructed by plotting the generalised phase difference against time. Horizontal lines on this plot indicate phase-locking, as the phase is seen to remain unchanged over time. As discussed previously, the generalised form given in Eq. 5 does not take into account noise. Eq 6 is relevant for simple phase synchronisation of ratio n:1, exhibiting n horizontal lines.
However, a more general form is needed for n:m synchronisation. For this an additional factor of m is required to adjust the phase to 2πm.
The factor m indicates phase wrapping (Pikrovsky, 2001). The value of m is chosen by trial and error. In perfect n:m phase-locking, exactly the same n values of ECG will occur within m adjacent respiratory cycles (Lotric, 2000).
Finally, a numerical measure for the strength of synchronisation is considered, in the work of Tass et al. (1998). As synchronisation has been considered in a statistical sense, it has no quantifiable strength index. Using conditional probability an index can be derived. First consider the phases of the two systems, ϕ1 and ϕ2. If the interval between each phase is divided into N 'bins' and calculate:
for all k such that ϕ1(tk) is in "bin" l and Ml is the number of points in this particular bin. Complete phase-locking (mutual interdependence) would mean a value of |rl(tk)|=1, and no dependence whatsoever would yield a value of |rl(tk)|=0. The average across all bins is calculated to determine the strength of phase-locking:
This represents the conditional probability that ϕ2 has a certain value, assuming ϕ1 is located within a certain "bin". In the research detailed by (Tass, 1998) an average phase strength is taken over the entire time series. As this includes areas of no synchronisation and others of just frequency synchronisation, the phase strength index will not give an accurate numerical representation of the strength during the period of complete phase-locking (Eq. 9 is not dependent upon frequency synchronisation).
Methodology
Laboratory preparation
In order to obtain the time series of respiration and heart rate the two types of signals, electrocardiogram and respiration, needed to be measured and recorded accurately. Before experimentation could begin, a lab had to be established in the School of Engineering, University of Warwick, to allow for the measuring and recording of vitals. Once the laboratory was prepared, an experiment had to be designed to instigate phase-locking synchronisation in volunteers. The procedure had to be rigorous, to ensure the desired results were produced, yet not so complicated as to be impractical or too time consuming.

Figure 2: The lab set-up, with bed on the left ready to be positioned, necessary computers on the desk and the blue BIOPAC module (with a unit code of MP36) in the middle of the picture.
Necessary knowledge was gained through use of the BIOPAC manual. ECG signals are the constructed waveform of the polarisation and depolarisation of chambers within the heart as it beats. From this waveform, rate and regularity could be calculated. For the set-up provided in the BIOPAC package, electrodes were placed at the extremities and the echo of the voltage was detected and transmitted onto the computer. Three leads exist around the heart, known as the Einthoven triangle, explained in the electrocardiogram chapter of BIOPAC manual.
To measure these leads, electrodes must be placed in the correct configuration around the body. The right leg is the ground for all leads, and corresponds to the black connection on the transducer attachments for the MP36. The red connection is the positive cable, the white is the negative. The correct configurations are given in Table 1.
| Lead | Positive (red) | Negative (white) | Ground (black) |
|---|---|---|---|
| 1 | Left wrist | Right wrist | Right ankle |
| 2 | Left ankle | Right wrist | Right ankle |
| 3 | Left wrist | Left ankle | Right ankle |
Table 1: Correct lead configurations
Positioned around the diaphragm of the volunteer, the respiration belt translated changes in volume due to in-and-exhalation into a waveform on the BIOPAC software. That allowed for each breath to be measured and recorded in a separate time series corresponding directly to the ECG signal being measured at the same time.
Eleven healthy volunteers were asked to participate in the measurements. Age was capped between 18 and 30, to include the majority of students on campus. The intention was to have a minimum of five healthy, athletic volunteers, and then a number of less active volunteers for comparison.
Experimental design
The aim of the experiment, as stated previously, was to determine the relationship between heart rate and frequency of respiration, for various frequencies of respiration, in particular at frequencies equal to or greater than resting heart rate. In order to see a transition period prior to this, it was determined that a frequency of respiration slightly below would also be tested, at 90% of heart rate. Finally, a value slightly above the point (110% of heart rate) at which it was hypothesized that synchronisation would occur (Pokrovskii, 2002) was selected. After some data had been collected, however, it was observed that little synchronisation occurred. A slightly higher value might initiate greater levels of synchronisation; therefore respiration frequency at 120% of baseline heart rate was selected.
The recordings at all frequencies took place for 100 cycles. Between these experiments rest periods were included, to allow the volunteers to return to normal levels of respiration and for the heart rate to recover fully to its resting value. Inspiration for this came from the experiments detailed in Potyagailo (2003). Through initial tests carried out in the laboratory, it was found that 4 minutes was ample time for a person to return to resting heart rate values, after only 100 cycles of elevated breathing. During these rests, recording would not be stopped, in case areas of transience occurred following higher frequency respiration.
With these two inclusions, the experiment was taking shape. For a control measure, 10 minutes of recording were added to the start of each volunteer's experiment. This allowed extra time to settle and for additional information to be relayed to the volunteer concerning the procedure, if necessary.
The transducers were attached to the correct limbs (see Table 1). Leads I and III were selected to be used in conjunction as a redundancy, increasing the chance of at least one strong signal for ECG (the best lead for an individual could be found using the cardio mean vector from Einthoven's Triangle, but to carry out this procedure for each volunteer would be too time consuming).
Once all the transducers were attached correctly, the BIOPAC software was set to start recording. An initial 15-20 minutes was given to ensure that the volunteer settled. From this resting recording, a baseline heart rate value was measured, taking an average from several areas of the waveform. This resting value was then used to calculate the relevant frequencies of respiration for the volunteer to complete the 100 cycles at 90%, 100% and 120% of heart rate.
Ensuring the volunteers breathed as closely to the required frequencies as possible was essential. In (Potyagailo, 2003) a flashing light was used as a stimulus, and volunteers had to breathe in time with it. This did not seem the most accurate method, as a controller operated the light for each flash. The simplest format conceived was to have volunteers breathe in time with a waveform on a monitor, such as a moving sine curve (see Figure 3).
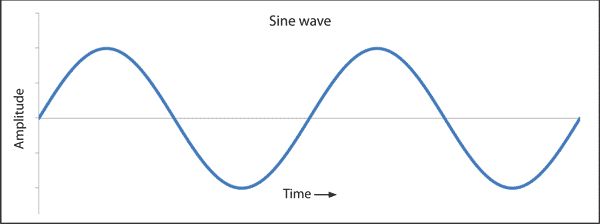
Figure 3: A sine wave (Anon1, n.d.)
A mechanical solution was deemed most practical, as it could easily be adapted to change speed dependent upon the frequency required for each volunteer. Rather than construct a generator, a model was designed on Solidworks, a computer aided design (CAD) package (Solidworks, 2014).
The design was based upon the idea of a zoetrope, an old-fashioned machine which by spinning very fast gave the impression of projecting a moving image (Figure 4). Basing a sketch on this toy, a design was created which produced a pattern to follow, such as the sine wave in Figure 3, for the respiration frequencies required throughout recording. This added consistency to measurements, as regardless of speed, each person had a proportionally similar length of breath.
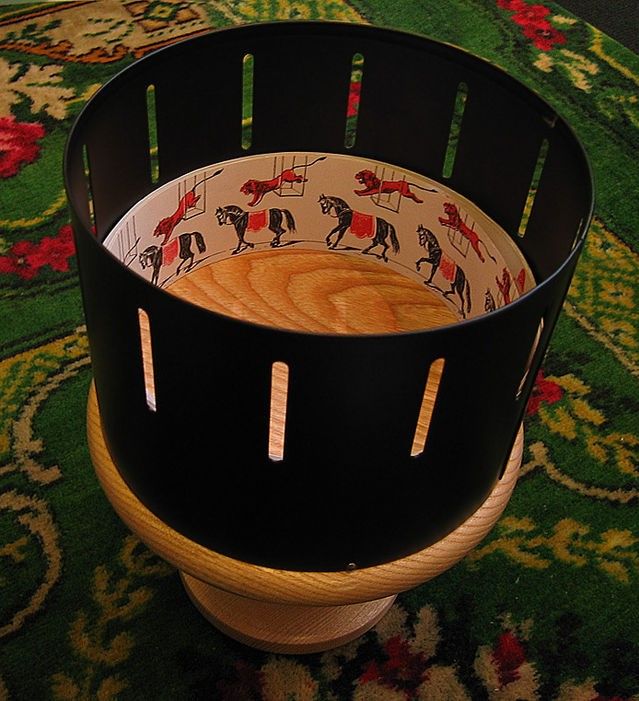
Figure 4: A zoetrope (Anon2, n.d.)
The model was drawn up in the CAD package, etching an appropriately sized sine wave into a cylinder, which would rotate around a simple shaft. This was placed upon a stand and a screen constructed. The screen allowed for only a small section of the waveform to be viewed at a time, so a person could follow the pattern more accurately. The finished model as seen by volunteers is presented in Figure 5. Solidworks has the feature of running simulations, which move in real time. An input motor was applied to the cylinder to drive it, and a rotational velocity of any value could be selected. This made it very adaptable, and the various values of respiration frequency required for all the volunteers were easily inputted. An Excel spreadsheet was set up to calculate the rotations per minute (RPM) required for the motor at the three frequencies of respiration for each individual. The animation of the cylinder was then initialised, and the rotating sine wave was viewed through the screen window on a monitor above the bed.
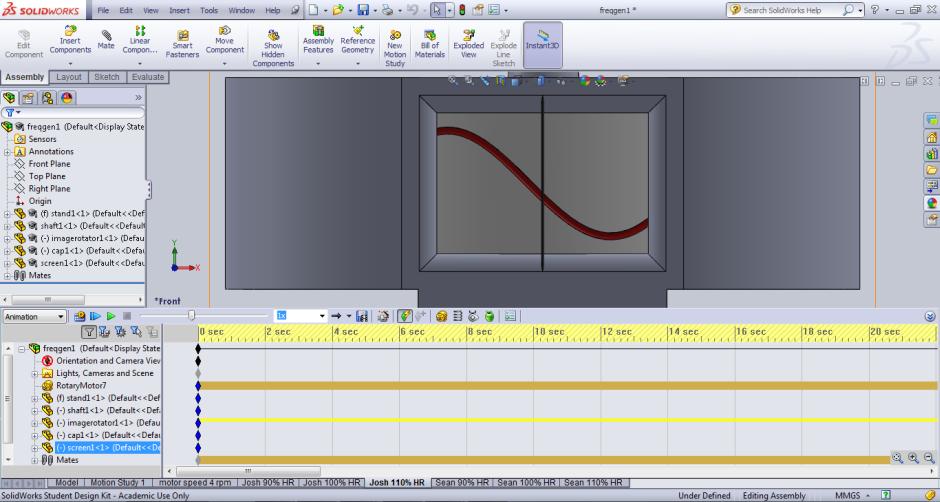
Figure 5: The completed model in use, with the simulation window open at the bottom of the screen, the cylinder with etched sine wave 'moving' across the screen window from left to right.
As the waveform span on its axis, the volunteer was instructed to inhale as the graph rose (positive gradient) and to exhale as it fell (negative gradient). The waveform was viewed through the window. A summary of the experimental procedure is presented in Figure 6.
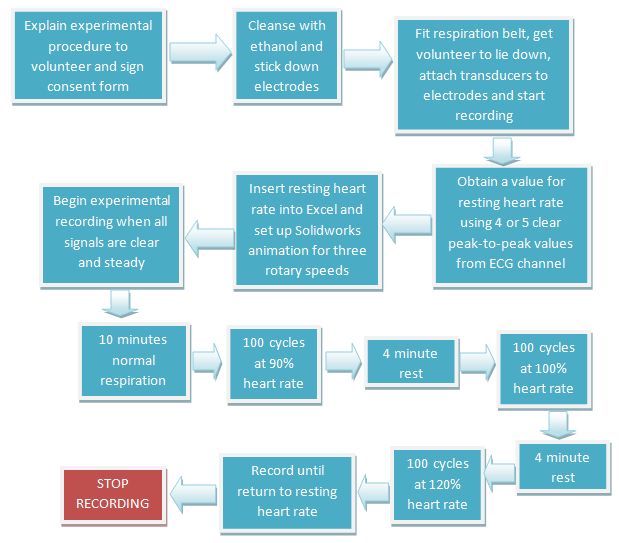
Figure 6: Summary of the experimental procedure.
Extraction of the peaks of the ECG and respiration signals
Peak extraction was required in order to analyse any interconnection between the two cardiorespiratory systems. This is to form the respective instantaneous frequencies of heart rate from ECG and respiration rate from the raw data. Peaks can be found using interpolation methods (Pikrovsky, 2001). Processing software (Bandrivskyy, 2003) was used to extract the required peaks from the relevant signals.
Data from the BIOPAC module was inputted into the processing software. A threshold value for each signal was chosen, and any value perceived as a peak above this value was highlighted by the software. Each point had to be validated, removing incorrect peaks and carefully adding any missed peaks into the time series.
With the peak values for ECG and respiration extracted from the raw BIOPAC data, the phase differences were plotted on synchrograms to determine if phase-locking occurred.
Results
The synchrogram (Figure 7) shows phase difference between the cardiac and respiratory systems against time. Each synchrogram (Figure 7) contains seven various breathing regimes (as in Figure 6) and starts on the left with the resting heart rate, followed by 100 cycles at 90%, 100% and 110% of rest heart rate alternated with 4 minutes resting episodes, and finishes by recording the return to resting heart rate. Parallel horizontal lines show phase-locking. The number of horizontal lines determines the ratio of locking (1 line on 1:m plot gives 1:1 locking; similarly, 2 lines on 2:m plot gives 1:1 locking). These conditions are used to analyse the resultant synchrograms from the experimental data, to further determine the nature and importantly strength of interconnections visible in the instantaneous frequency plots. Areas of 1:1 synchronisation episodes on the synchrograms are circled in red.
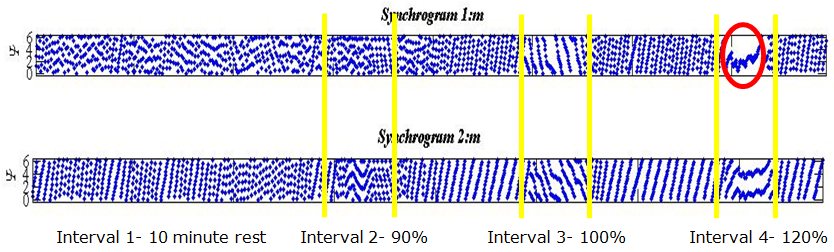
Figure 7: Two synchrogram outputs for a single volunteer.
Discussion
Phase-locking of lower order rations, such as 5:1, have been recorded in previous experimentation during rest for volunteers. This is confirmed by five horizontal lines within the 1st interval: five horizontal lines can be seen to move through the first 10 minutes of the synchrogram plot, prior to the onset of the first forced respiration period. The area of 1:1 synchronisation occurs at a respiration rate slightly greater than baseline heart rate, i.e. 120% value (interval 4). The three periods of high-frequency respiration are indicated by the yellow dividers and intervals (90% is interval 2, 100% is 3 and 120% is 4). These areas clearly show a stronger interaction than experienced during periods of rest.
Looking now at the areas of particular interest (intervals 2, 3 and 4), it can be seen in Figure 7 that for this volunteer, locking of ratio 2:3 occurred during the first forced respiration period (90% of baseline heart rate, interval 2). This corresponds to two breaths for every three heartbeats. Most excitingly, during the final period of forced respiration, the dots in the plot can be seen to converge to a single line. This represents the phase remaining unchanged. 1:1 locking is observed here, clearly visible in both plots (1:1 and 2:2 respectively).
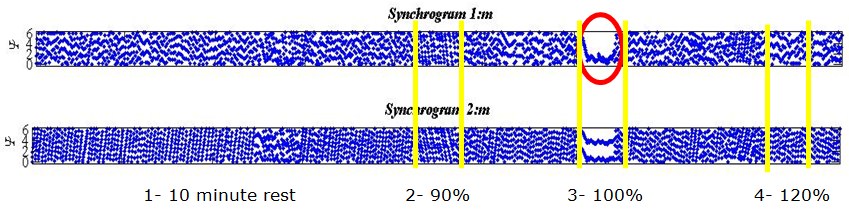
Figure 8: Two output plots for different volunteer.
It should be noted that for this volunteer (Figure 8) the first period of high-frequency respiration (interval 1) was repeated due to them struggling to follow the zoetrope, hence the longer time series. Unlike the previous example, the strongest interconnection for this person occurred during the second period of high-frequency respiration (i.e. 100% baseline heart rate, interval 3). Once again, a clear 1:1 locking is observed. In both these examples, 1:1 locking is held for an extended period of 50-60 seconds. Once all the synchrograms had been analysed in a similar way, it could be observed that higher order locking, previously observed, is validated in all results usually with values around 7:1, 6:1 or 5:1, an interconnection was seen to exist during most periods of rest.
Full results stating the lowest order of locking to occur during the periods of forced frequency respiration are collated in Table 2. Athletic individuals are marked with an asterisk, to highlight whether any noticeable difference occurs.
| Volunteer | Phase-locking | Interval | Ratio | Duration |
|---|---|---|---|---|
| B* | Possible | 4 (120%) | 1:1 | 5 seconds |
| C* | Yes | 4 (120%) | 1:1 | 60 seconds |
| D | Yes | 4 (120%) | 1:1 | 10 seconds |
| E | Yes | 3 (100%) | 1:1 | 60 seconds |
| G | No | N/A | N/A | N/A |
| K | Possible | 4 (120%) | 1:1 | 5 seconds |
| M | Yes | 3 (100%) | 1:1 | 20 seconds |
| M | Yes | 4 (120%) | 1:1 | 40 seconds |
| Q* | Yes | 4 (120%) | 1:1 | 30 seconds |
| T* | Yes | 4 (120%) | 3:2/1:1 | 30 seconds |
| U* | Yes | 3 (100%) | 1:1 | 10 seconds |
| V* | Yes | 4 (120%) | 1:1 | 50 seconds |
Table 2: Summary of phase-locking for each individual, including the duration.
Ten of the 11 volunteers displayed epochs of phase-locking in low order ratios. Some were for extended periods, exceeding 30 seconds.
Improvements for future testing could involve longer periods of high-frequency respiration, as previously stated. This would allow for the potential of longer windows of synchronisation to be recorded. Additionally, different frequencies of respiration should be investigated, as 100% heart rate worked for some while 120% for others. A value in between may be beneficial to record positive results of phase-locking for a greater number of volunteers (contrary to earlier speculation concerning using 110% of heart rate). Further work is required to investigate the maximum possible durations of the synchronisation episodes in healthy volunteers. Finally, the type of participants could be considered. This initial experiment drew on a mix, with half being athletic and active most of the week, while the rest did little physical activity of note. All the athletes in this group displayed phase-locking, many for an extended period. More rigorous testing carried out on a select number of athletes has the potential to lead to strong results, as hinted in previous research (Schafer, 1999). Longer periods of high-frequency respiration would be little difficulty to these individuals and a broader range of results could be collected for a number of frequencies. Experiments over a prolonged period of time could be carried out to determine if a correlation exists between the strength of interconnection within the cardiorespiratory system, likelihood of phase-locking and the fitness level of an individual. By completing experiments before and after beginning a training regimen for a number of months, the overall effect of fitness on these systems could be determined.
Conclusion
Previous research was validated, hypotheses from literature were tested and a different experimental procedure was carried out. This new experimental design can be extrapolated and expanded upon for further research, with some of the techniques for detecting synchronisation taken forward.
After completion of analysis, the results showed explicitly that phase-locking synchronisation can occur in frequencies of respiration exceeding that of the baseline heart rate. Expanding on the use of synchrograms, analysis was simple and easily communicated, as the plots are easy to read.
Phase-locking was seen to occur in 10 of 11 volunteers, mostly in frequencies of respiration greater than heart rate. As this was the aim from the onset of the research, the result has been an unambiguous success. Clear data was collected and analysed thoroughly. These conclusions can now be tested further to determine the relationship experienced between the cardiac and respiratory systems, when it is strongest and why.
Acknowledgements
I would like to extend my sincerest gratitude to Dr Natasha Khovanova for supervising my progression with this challenging research, where her extensive knowledge in computer modelling and Matlab codes has been invaluable. The application of such modelling techniques into biomedical applications is an area of particular interest to Dr Khovanova, and her genuine enthusiasm and inspiration has allowed for successful completion of the research, and for this I am grateful.
I would also like to thank Josh Williams, a fellow third-year Engineering student, who ran a project in conjunction with my own. Despite the different aims of our respective research, lab set-up and the carrying out of experiments was completed together, as the workload would have been too large for an individual. Through good communication and cooperation, we completed the experiments together effectively.
List of figures
Figure 1: R-R interval in ECG signal (screenshot from recording software).
Figure 2: The lab set-up, with bed on the left ready to be positioned, necessary computers on the desk and the blue BIOPAC module in the middle of the picture.
Figure 3: A sine wave (Anon1, n.d.)
Figure 4: A zoetrope (Anon2, n.d.)
Figure 5: The completed model in use, with the simulation window open at the bottom of the screen, the cylinder with etched sine wave "moving" across the screen window from left to right.
Figure 6: Summary of the experimental procedure.
Figure 7: Two synchrogram outputs for a single volunteer.
Figure 8: Two output plots for different volunteer.
List of tables
Table 1: Correct lead configurations.
Table 2: Summary of phase-locking for each individual, including the duration.
Notes
[1] Sean Perry has just completed his third year of a Master's degree in Mechanical Engineering at the University of Warwick, achieving a First class. Before finishing his degree, he is taking a year out to work at Rolls-Royce as part of the Central Manufacturing Systems' team to gain experience for his future career in the aerospace sector.
For a more detailed review of this research, as well as full results and analysis, please contact: Sean dot Perry at warwick dot ac dot uk
This research was presented in conjunction with research done by Josh Williams at the British Conference of Undergraduate Research.
For any more information around this area of research, please contact Dr Natasha Khovanova: N dot Khovanova at warwick dot ac dot uk
References
Anon1 (n.d.), 'Minelab', available at http://www.minelab.com/consumer/knowledge-base/terminology, accessed 10 March 2014
Anon2 (n.d.), 'Wikipedia Article - Zoetrope', available at http://en.wikipedia.org/wiki/Zoetrope#mediaviewer/File:Zoetrope.jpg, accessed 30 September 2014
Bandrivskyy, A. (2003), 'Processing software for ECG and respiration signals', unpublished PhD thesis, Lancaster University
Gabor, D. (1946), 'Theory of Communication', Electrical Engineers,93 (26), 429-41
Glass, L. and M. C. Mackey (1988), From Clocks to Chaos: The Rythems of Life, Princeton: Princeton University Press
Lotric, M. B. and A. Stefanovska (2000), 'Synchronisation and modulation in the human cardiorespiratory system', Physica, 283, 451-61
McClintock, P. V. E. and A. Stefanovska (2003), 'Interactions and synchronisation in the cardiovascular system', World Scientific, 3 (2), 167-76
Pikrovsky, A., M. G. Rosenblum and J. Kurths (2001), Synchronisation: a universal concept in nonlinear science, Cambridge: Cambridge University Press
Pokrovskii, V. M., V. G. Abushkevich, I. I. Borisova, E. G. Potyagailo, A. G. Pokhot'ko, S. M. Khakon and E. V. Kharitonova (2002), 'Cardiorespiratory synchronism in humans', Human Physiology, 28 (6), 728-31
Potyagailo, E. G. and V. M. Pokrovskii (2003), 'Cardiorespiratory synchronisation in evaluation of the functional status and regulatory adaptive resources in children', Human Physiology, 29 (1), 49-52
Prokhorov, M. D., V. I. Ponomarenko, V. I. Gridnev, M. B. Bodrov, A. B. Bespyatov (2003), 'Synchronisation between main rhythmic processes in the human cardiovascular system', Physical Review, 68
Rhoades, R. and D. R. Bell (2013), Medical Physiology: Principles of Clinical Medicine, Walters Kluwer
Saladin, K. (2012), Anatomy and Physiology: The Unity of Form and Function, McGraw-Hill, 714-48, 854-94
Schafer, C., M. G. Rosenblum, J. Kurths and H. H. Abel (1998), 'Heartbeat synchronized with ventilation', Nature, 392, 239-40
Schafer, C., M. G. Rosenblum, H. H. Abel and J. Kurths (1999), 'Synchronization in the human cardiorespiratory system', Physical Review, 60 (1), 857-70
Sheikh-Zade, IuR., M. V. Kruchinin, L. I. Sukach, V. M. Pokrovskii and G. T. Urmancheva (1987), 'General principles of heart rate control during burst stimulation of vagus nerve in various animals', Fisiol, 73 (10), 1325-30
Tass, P., M. G. Rosenblum, J. Weule, J. Kurths, A. Pikovsky, J. Volkmann, A. Schnitzler and H. J. Freund (1998), 'Detection of n:m phase-locking from noisy data: application to magnetoencephalography', Physical Review, 81 (15), 3291-94
van der Pol, B. and J. van der Mark (1928), 'The heartbeat considered as a relaxation oscillation and an electrical model of the heart', Philosophical Magazine, 6, 763-75
To cite this paper please use the following details: Perry, S. (2014), 'The Investigation of Interaction between Heart and Respiration Dynamics for Various Respiration Frequencies', Reinvention: an International Journal of Undergraduate Research, BCUR 2014 Special Issue, http://www.warwick.ac.uk/reinventionjournal/issues/bcur2014specialissue/perry/. Date accessed [insert date]. If you cite this article or use it in any teaching or other related activities please let us know by e-mailing us at Reinventionjournal at warwick dot ac dot uk.