Dissolution Kinetics of Scolecite in Alkaline Environments
by Lingchen Mao, Department of Bioscience, University of Nottingham [1]
Abstract
To further understanding of processes that may occur around an underground radioactive waste repository, the dissolution rate of scolecite, a type of zeolite, has been studied. It is observed that its dissolution rate is largely influenced by pH and temperature. By measuring the rate of silicon release, at 25°C, the initial dissolution rate of scolecite is 10-14.5mol cm-2s-1at pH 8 and it increases as pH rises. At pH 12, the dissolution rate is 10-13.9mol cm-2s-1. By using the Arrhenius kinetics, the activation energy of scolecite is calculated as 37.74kJ mol-1at pH 12 and 48.01kJ mol-1at pH 13, based on aluminium release. It is also observed that this effect of pH on the dissolution rate of scolecite is strongly affected by temperature. The relationship between the dissolution rate and alkalinity of the solution can be expressed by the equation: k ∝ (aOH-)n in basic pH. The reaction order n increases when the temperature is elevated, which implies an enhancement of the influence of alkalinity on scolecite dissolution.
A high level radioactive waste repository will locally result in a very alkaline pH and increased temperature. Scolecite forming around a repository as a result of hot fluid circulation has the ability to retard radionuclides, but has a relatively low cation exchange capacity. The calculated lifetime of a 1mm scolecite spherical crystal is 15,000 years in a pH 13 and 70°C environment, which is however long compared with other zeolite minerals such as heulandite.
Key words: dissolution kinetics, scolecite, alkaline, radioactive waste, geological disposal
Introduction
With the accelerating usage of nuclear energy, the management of radioactive waste has to be given more consideration. In the last few years, the UK government has published a series of strategies for managing high-level radioactive waste. The most favourable option is the so called “deep geological disposal” strategy, which is designed to minimise the contamination of the environment (Figure 1). This strategy makes the understanding of reactions in the underground environment, especially around the disposal repository, much more important.
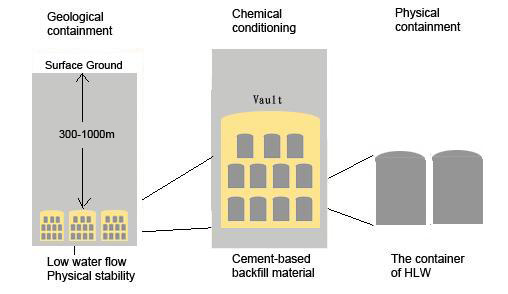
Figure 1: Illustration of the concept of the ‘deep geological disposal’.
(adapted from Nirex Report, N122)
Deep underground, the reaction between rock and water can produce different kinds of secondary minerals. One of the most important mineral types is zeolite. Zeolite is a kind of aluminosilicate mineral that is widely spread in both near-surface environments and deep-sea pelagic sediments. It forms during water-rock interactions below roughly 300°C and 2kbar. Because of their special cage and channel structure, zeolites are able to capture elements including radionuclides by ion exchange. To take advantage of this property, zeolite can be utilized as packaging in a high-level radioactive waste container. Moreover, to minimise the mobilisation of radionuclides, the repository can be sited where (i) the host rock has abundant zeolites which can act as a barrier of radionuclides mobilisation when the container is breached; (ii) the flow rate of groundwater is very low; (iii) the local environment is alkaline (e.g. as a result of cement usage), since the solubility of a number of radionuclides is low in an alkaline environment. Besides these three factors relating to the underground environment, it has been shown that high-level radioactive waste may lead to a significant temperature rise in the fluid circulating in the host rock as a result of their radioactivity. So it is important to study the solubility and stability of zeolites under such environmental conditions.
The stability of aluminosilicate minerals, including zeolites, is highly dependent on their solubility in different environments. Previous research shows that the dissolution rates of aluminosilicates observed at neutral pH vary over five orders of magnitude. The lowest observed rate is that of kaolinite of 10-17.8mol cm-2 s-1, whereas the highest rate is for nepheline 10-12.8mol cm-2 s-1(Table 1)(Brady and Walther, 1989, 1990).
Although variation does exist among different kinds of zeolites, the general patterns of change in dissolution rate against pH/temperature are similar. The higher the temperature the faster the mineral dissolves, as a result of the greater kinetic energy in the solution. In an acidic solution, the dissolution rate of zeolites declines as pH increases; when the pH of the solution is in the neutral range, typically between 6 and 7, the value of the dissolution rate reaches its lowest and becomes stable; and as pH continue rising, the rate starts to increase again. This U-shaped dissolution behaviour of zeolite as a function of pH is similar to that of many silicates (Brady and Walther, 1989).
|
Mineral |
Log Dissolution Rate |
Sources |
|
Quartz |
-16.0 |
1 |
|
Feldspars |
-15.5 to -16.0 |
2,3,4,5 |
|
Olivine |
-14.0 |
6,7 |
|
Pyroxenes |
-13.8 |
8 |
|
|
-15.2 |
9,10 |
|
Nepheline |
-12.8 |
11 |
|
Kaolinite |
-17.8 |
12 |
|
Laumontite |
-17.0 |
13 |
|
Heulandite |
-16.6 |
14 |
|
Chrysolite |
-16.0 |
15 |
Table 1: Dissolution rates of minerals at 25℃ and pH 7 based on silicon release, corrected to the number of oxygen atoms per formula unit (mol cm-2s-1)
(1Brady and Walther, 1990; 2Chou and Wollast, 1985; 3Amrhein and Suarez, 1988; 4Knauss and Wolery, 1986; 5Brady and Walther, 1989; 6Blum and Lasaga, 1988; 7 Wogelius and Walther, 1991; 8Knauss et al., 1991; 9Shott et al., 1981; 10Wogelius and Walther, unpubl. data; 11Tole et al., 1986; 12Carroll-Webb and Walther, 1988; 13Savafe et al., 1992; 14Ragnarsdottir, 1992;15Bales and Morgan, 1985)
Although dissolution measurements have been made for other zeolites, e.g .clinoptilolite and heulandite, little is known about scolecite, either its dissolution rate or its chemical weathering reaction with its environment. Scolecite is an igneous zeolite and is usually crystallized in cavities and along fractures in basalt from the aqueous solutions corresponding to the last stages of magmatic activity. The chemical composition of scolecite is CaAl2Si3O10-3H2O and because of its framework structure, it has a low density, 2.275g/ cm3 .
To investigate the relationship of the dissolution rate of scolecite with temperature and pH, an experiment was designed whereby Si, Al and Ca concentrations were determined when scolecite samples were dissolving in buffer solutions with different alkalinities and temperatures. Understanding the behaviour of scolecite in an alkaline environment at different temperatures will help us to understand: first, if scolecite is a suitable material to be used as a barrier in a high-level radioactive waste package in a deep geological disposal repository; and second, the stability of scolecite where it is likely to be produced as a secondary mineral deep underground.
Material and Experimental Procedures
The scolecite used in this experiment was a fibrous and transparent aggregate. It was crushed using a geological hammer into smaller fractions. The fractions were assumed to consist of spherical particles, and were sieved to a range of 300-500μm. Impurities were removed manually where possible, but some small contamination of the samples may be present. As dissolution rate can be influenced by the surface reaction area of the mineral, the total external surface area of each sample was calculated geometrically. The mass and total surface area of scolecite in each experiment is listed in Table 2.
|
pH |
Temperature(℃) |
Mass of Sample (g) |
Number of Spheres |
Total Surface Area (m2) |
|
8 |
25 |
0.49 |
6457 |
3.25×10⁻³ |
|
50 |
0.50 |
6535 |
3.29×10⁻³ |
|
|
70 |
0.48 |
6234 |
3.13×10⁻³ |
|
|
9 |
25 |
0.50 |
6549 |
3.29×10⁻³ |
|
50 |
0.52 |
6785 |
3.41×10⁻³ |
|
|
70 |
0.50 |
6535 |
3.29×10⁻³ |
|
|
10 |
25 |
0.51 |
6667 |
3.35×10⁻³ |
|
50 |
0.49 |
6391 |
3.21×10⁻³ |
|
|
70 |
0.49 |
6470 |
3.25×10⁻³ |
|
|
11 |
25 |
0.57 |
7441 |
3.74×10⁻³ |
|
50 |
0.49 |
6483 |
3.26×10⁻³ |
|
|
70 |
0.53 |
6890 |
3.46×10⁻³ |
|
|
12 |
25 |
0.52 |
6759 |
3.40×10⁻³ |
|
50 |
0.51 |
6680 |
3.36×10⁻³ |
|
|
70 |
0.51 |
6667 |
3.35×10⁻³ |
|
|
13 |
25 |
0.50 |
6562 |
3.30×10⁻³ |
|
50 |
0.54 |
7113 |
3.58×10⁻³ |
|
|
70 |
0.52 |
6850 |
3.44×10⁻³ |
Table 2: The mass (g) and the total surface area (m2) of each scolecite samples.
Batch experiments were performed in low-density polyethylene bottles at 6 pH values ranging from 8 to 13. The composition of the buffer solutions is shown in Table 3. For each pH, experiments were performed at three different temperatures: 25°C which is room temperature (RT), 50°C, and 70°C. To achieve 50 and 70°C, the bottles containing a measured amount of scolecite were placed into thermostatically controlled shaking water baths.
The fluid phase was sampled at intervals by pipette with a 10ml sample removed each time. Previous work has shown that it is not necessary to filter the samples. Reactors were weighed prior to and after removing the fluid and the time of sampling, temperature and pH of the fluid were recorded. At first, sampling was made more frequently, anticipating that the dissolution rate would decrease with time. The total duration of the sampling was 167 hours.
|
Composition of buffers |
Calculated |
Measured pH at RT |
|
|
100ml 0.1M H3BO3 |
3.9 ml 0.2 M NaOH |
8 |
7.99 |
|
100ml 0.1M H3BO3 |
20.8ml 0.2M NaOH |
9 |
9.01 |
|
100ml 0.025M Na2B4O7.10H2O |
18.3ml 0.2M NaOH |
10 |
9.91 |
|
100ml 0.025M Na2B4O7.10H2O |
24.25ml 0.2M NaOH |
10.8 |
10.44 |
|
50ml 0.2M KCl |
12ml 0.2M NaOH |
12 |
12.05 |
|
50ml 0.2M KCl |
132ml 0.2M NaOH |
13 |
12.76 |
Table 3: Reagents of buffer solution (RT is room temperature, around 25oC)
The samples were stored in plastic tubes before analysis. To prevent mineral precipitation, each was acidified using 0.5ml of 50% HNO3to pH <2. The concentrations of Al and Ca in each sample were measured by ICP-MS (inductively coupled plasma-mass spectrometry), while the concentration of Si was detected colorimetrically. The initial dissolution rate of the scolecite was calculated from the gradient of the linear region of element release and the total surface area of each scolecite sample:
R [mol cm-2 s-1] = Gradient [mol h-1] / A [cm2] / (60 x 60)
Results
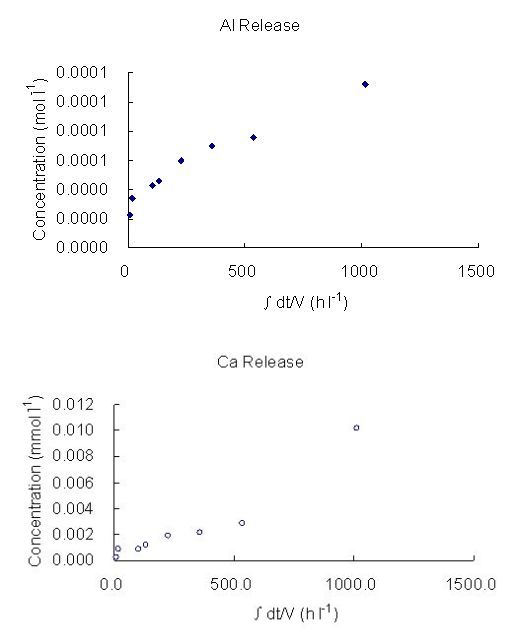
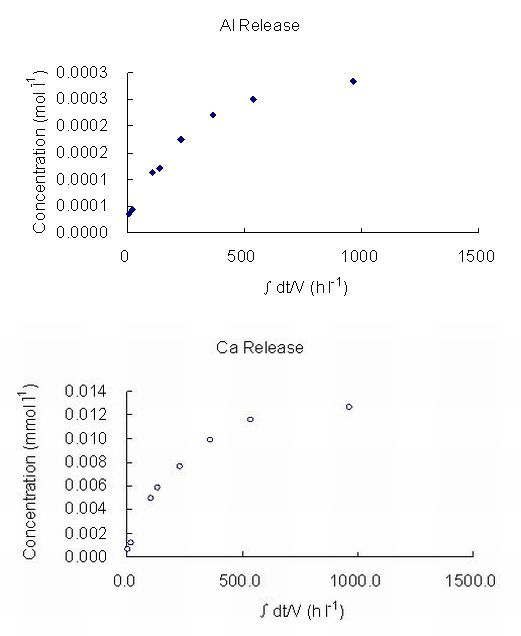
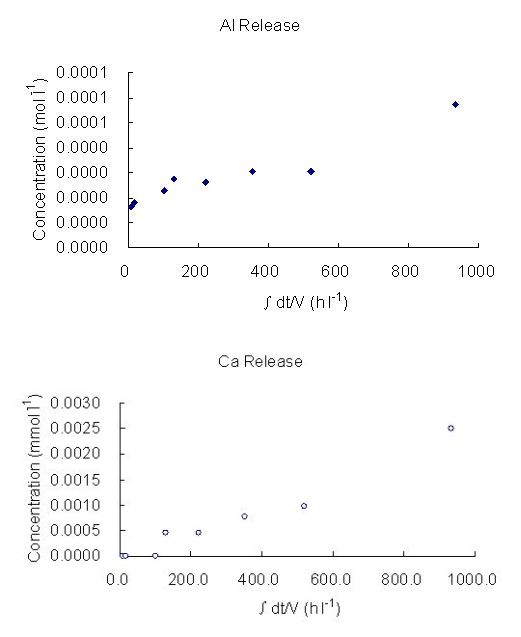
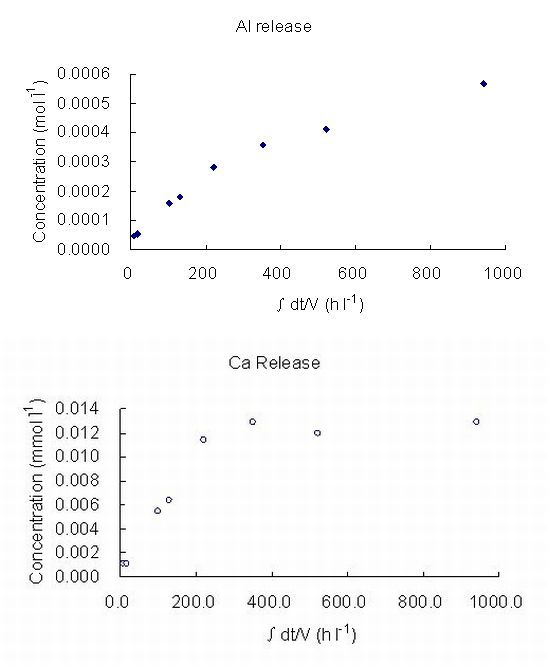
The log dissolution rates obtained in this experiment, based both on silicon and aluminium releases, are shown in Table 4. The releases of Al and Ca against time at very high pH (12, 13), at 25°C, 50°C and 70°C are presented in Figure 2. The dissolution rates and their relationship with pH obtained are shown in Figures 3 and 4. Some high concentration values can be the results of contamination during or after sampling. For example, when sampling, a scolecite particle may have been extracted with the fluid and dissolved when acidification was undertaken to prevent precipitation. Filtering would have avoided this but, with care, is not usually necessary. The stoichiometric dissolution reaction of scolecite is as follows:
CaAl2Si3O10•3H2O+7H2O →Ca2++2Al(OH)4-+3Si(OH)4(aq)
However, as also found in many other studies, the initial releases of Al and Si are not stoichiometric (Ragnarsdottir, 1992; Wollast and Chou, 1985; Holdren and Speyer, 1985). In this study, aluminium release is about two magnitudes faster than silicon (Table 4). Previous experiments on heulandite show that the dissolution rate reaches steady state after 300-500 hours of dissolution (Ragarsdottir, 1992). In this study, steady state dissolution was not reached at 167hr.
|
|
25℃ |
50℃ |
70℃ |
||||
|
pH |
Log RSi |
Log RAl |
Log RSi |
|
Log RAl |
Log RSi |
Log RAl |
|
7.99 |
-14.458 |
N/A |
-13.515 |
|
N/A |
-14.349 |
-12.680 |
|
9.01 |
-14.003 |
N/A |
-13.912 |
|
N/A |
-13.926 |
-12.265 |
|
9.91 |
-14.194 |
-12.074 |
-14.485 |
|
-12.415 |
-13.824 |
-12.405 |
|
10.44 |
-13.874 |
N/A |
-13.733 |
|
-12.382 |
-13.710 |
-12.488 |
|
12.05 |
-13.953 |
-12.178 |
-9.792 |
|
-11.910 |
-13.770 |
-11.279 |
|
12.76 |
-14.381 |
-12.170 |
-13.841 |
|
-11.678 |
-13.641 |
-11.046 |
|
Average |
-14.093 |
-12.138 |
-13.801 |
|
-11.986 |
-13.821 |
-11.581 |
Table 4: Log dissolution rate (mol cm-2s-1) based on Si and Al releases.
(a)
(b)
(c)
(d)
Figure 2: The Concentration of Al and Ca in buffer solution as a function of time at:
(a) pH 12, 50°C (b) pH 12, 70°C (c) pH 13, 25°C (d) pH 13, 70°C
(∫dt/V, stands for accumulated time variance in unit volume).
Figure 3: Log dissolution rate of scolecite against pH based on Si release at 25°C, 50°C and 70°C. S denotes slope.
Figure 4: Log dissolution rate of scolecite against pH based on Al release at 50°C and 70°C. S denotes slope.
The relationship between dissolution rate and temperature is shown in Figures 5 and 6. Theoretically, the dissolution rate increases when the temperature is rising. However, a reduction is observed for Al release at pH 10 that it is not observed in the Si results. This suggests a potential problem of Al an phase precipitating out, during the experiment. A decrease in Al concentrations may also occur if the buffering capacity of the buffer solution at pH 10 is very low. When the mineral is dissolving, the buffer solution tends to be influenced by the additional elements and can become unstable in pH/ionic strength. The increase of Si in experiments at pH 9, 11, 12 and 13 shows that the dissolution rate positively correlate with temperature. However, this increase is not as obvious as it might be expected to be perhaps as a result of poor preservation of Si in the sampled solutions.
Figure 5: Log dissolution rate (mol cm-2s-1) of scolecite against temperature based on Si release at different pH.
Figure 6: Log dissolution rate (mol cm-2s-1) of scolecite against temperature based on Al release at different pH.
The lifetime of the mineral can be calculated by applying the steady state dissolution rate to a hypothetical 1mm spherical scolecite crystal:
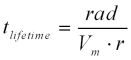
Where rad stands for the grain radius, in this case, assumed to be 0.05 cm in radius (1 mm in diameter), and Vmrefers to the molar volume in cm3mole-1(Lasaga et al., 1994, Wolff-Boenisch et al., 2004). According to previous research on other kinds of zeolites, the steady state dissolution rate is normally 0.5 to 1 orders of magnitude lower than its initial dissolution rate. Therefore, an assumption is made that the initial dissolution rate is 0.8 orders of magnitude higher than the rate when it reaches its steady-state condition after 300-500 hours. Depending on its surrounding temperature, the lifetime of the scolecite (1 mm in diameter) varies from 15,000 to 100,000 years (Table 5).
|
|
25℃ |
50℃ |
70℃ |
|||
|
pH |
Log Rate |
Lifetime |
Log Rate |
Lifetime |
Log Rate |
Lifetime |
|
7.99 |
-15.26 |
1.0×10⁵ |
-14.32 |
1.1×10⁴ |
-15.15 |
7.8×10⁴ |
|
9.01 |
-14.8 |
3.5×10⁴ |
-14.71 |
2.8×10⁴ |
-14.73 |
2.9×10⁴ |
|
9.91 |
-14.99 |
5.4×10⁴ |
-15.28 |
1.1×10⁵ |
-14.62 |
2.3×10⁴ |
|
10.44 |
-14.67 |
2.6×10⁴ |
-14.53 |
1.9×10⁴ |
-14.51 |
1.8×10⁴ |
|
12.05 |
-14.75 |
3.1×10⁴ |
N/A |
N/A |
-14.57 |
2.0×10⁴ |
|
12.76 |
-15.18 |
8.4×10⁴ |
-14.64 |
2.4×10⁴ |
-14.44 |
1.5×10⁴ |
|
Average |
-14.94 |
5.5×10⁴ |
-14.7 |
3.8×10⁴ |
-14.67 |
3.1×10⁴ |
Table 5: Log dissolution rate (mol cm-2s-1) and mean lifetime (years) of scolecite in different environments.
Using the Arrhenius Equation: 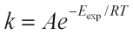 or
or 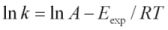 . Where k stands for dissolution rate, A is a pre-exponential factor (mol cm-2s-1), Eexpis the experimental activation energy (kJ mol-1), T is measured absolute temperature (K), and R is the molar gas constant: 8.314472 x 10⁻³kJ K-1mol-1. Based on the Si release, in the buffer solution at pH 13, the activation energy in kJ mol-1of scolecite mineral is calculated as 32.7kJ mol-1. The calculated activation energy based on Al release is 37.74 kJ mol-1at pH 12 and 48.01 kJ mol-1at pH 13 (Figure 7).
Figure 7: The Arrhenius Relation between Ln dissolution rate (mol cm-2s-1) and temperature (K) based on Al release.
Discussion
Similar to that of many other zeolites in previous studies (Lasaga, 1981, 1984), the dissolution rate of scolecite is largely influenced by its cation activity, which is determined by its alkalinity, in the solution. The experimentally determined pH dependence of rate constants can be written as:  in an acidic solution, and
  in an alkaline one, where k is the dissolution rate and n is generally referred to as the reaction order. As this study was focussed on the dissolution rate in alkaline solution,
  was used for discussion. Figures 3 and 4 show that the log dissolution rate increases linearly with pH from 8-13 based on both silicon and aluminium releases. It has been suggested by previous studies on dissolution kinetics of oxides that surface reactivity is dependent on surface species; this change in dissolution rate with pH and dissolved ligand concentration is also explained in terms of surface protonation (and deprotonation) and of ligand surface complexes (Lagache, 1965, 1976; Petrovic et al., 1976).
A SiO2reaction model has been used to understand the role of surface species in kinetics of silica-water reactions in aluminosilicate minerals dissolution (Iler, 1979; Hiemstra et al., 1989; Hiemstra and Van Riemsdijk, 1990). There are three complexes of differing charge that are thought to exist on silica surfaces in the solution: >Si—OH2+, >Si—OH and >Si—O- (>Si— denotes a surface silica site which is bound to the solid through one, two or three surface oxygens). At the pH of zero surface charge, pHpzc, there are equal numbers of positively and negatively charged complexes and the surface is electrically neutral. At higher pH the surface becomes increasingly negatively charged due to the ionization of the >Si—OH complex and the increased formation of >Si—O-. Different theories have been put forward to explain this increment in >Si—O-. Wirth and Gieskes (1979) suggest that at constant pH, >Si—O- appears to increase with ionic strength. Others argue that for some silicate minerals such as quartz, the density of >Si—O- is enhanced by specific adsorption of alkali cations rather than by increased ionic strength (Dove and Crerar, 1990). Despite these arguments, previous studies have shown that silicate dissolution rates increase as >Si—O- formation increases and that this increment in dissolution rates is a result of the detachment of a Si atom due to the presence of >Si—O- (Figure 8). Fleming (1986) noted that the detachment has no effect on the overall surface protonation as the subsequent regeneration of surface charge is rapid.
Figure 8: Log Quartz Dissolution Rates (mol cm-2 s-1) against Log Silica Surface Charge (nm-), in a 0.001 M NaCl solution (Bolt, 1952)
On the other hand, in a low pH environment, usually below the value of pHpzc, the dissolution rate is proportional to the concentration of the positively charged surface species >Si—OH2- (Wollast and Chou, 1986) and it increases with the decrease of pH.
Between the pH neutral and pHpzc, the dissolution rates are only weakly dependent on pH, as the detachment of charged surface species becomes minimal. It is suggested that the detachment rates in neutral solutions may be proportional to the concentration of the neutral species >Si - OH.
Transition state theory (Eyring, 1935) can provide a reason as to why an overall reaction rate is proportional to the surface species. In the solution, a rate-limiting elementary reaction occurs on the mineral surface. Take >Si - O for example, in an alkaline solution, the dominant activation equilibrium can be written as:
nH2O+>Si-O-∝ [(nH2O)(>Si-O-)]
where n is the number of water molecules involved in the activation reaction and (nH2O)(>Si - O-) is called the activated complex in the rate-limiting elementary reaction. Though the detail of the effect of the complex on reaction is not clear, it is believed that Si atoms are likely to be detached by hydrophilic attack of bridging bonds energetically weakened due to the presence of surface species.
The dissolution rate of scolecite is not only strongly affected by the pH but also by its temperature as shown in Figures 5 and 6. It is well known that the relationship between reaction rate and temperature can be modelled by the Arrhenius Equation (Figure 7). However, the results from this study show that the log dissolution rate of scolecite does not increase linearly with temperature as the Arrhenius Equation shows, but is more likely to be controlled heterogeneously. The heterogeneous reactions take place between solids and aqueous solutions whereas the surface structure of the mineral can influence the effect of temperature on the dissolution rate. The difference between activation energy (e.g.37.74 kJ mol-1at pH 12 and 48.01 kJ mol-1at pH 13 based on Al release)with different pH of the solution indicates that the influence of temperature can be affected by its pH, which, as discussed above, affects the surface structure of the mineral. Moreover, in the solution there is a substantial decrease of the dielectric constant of H2O with increasing temperature, which consequently affects the thermodynamic properties of aqueous species. It is also suggested by modelling that during the water-rock reaction, the dissolution is controlled by the activity of silica, and the products of the replacement reaction (Kerrisk, 1983). Therefore, for scolecite dissolution, temperature influences the activity of aqueous species, including Si(OH)4, Al(OH)4, Ca2+etc., which consequently controls the solubility and stability of the mineral. The results of this study can also be supported by previous research on clinoptilolite and analcime which shows that the values of ln dissolution rate increase with increasing temperature. But it does not depend linearly on 1/T as the Arrhenius Equation shows (Wilkin and Barnes, 1998).
Investigating the relationship between the dissolution rates of scolecite and pH, the reaction order n can be calculated as the slope of the graph (Figures 3 and 4), i.e. according to Si release, n is 0.0215 at 25°C, 0.0649 at 50°C and 0.1183 at 70°C, while according to Al release, n is 0.2682 at 50°C and 0.3457 at 70°C. According to these values, it can be concluded that the higher the temperature, the higher the reaction order, n. This implies that temperature can enhance the influence of pH on the initial dissolution rates of scolecite.
Based on the steady state dissolution rate, previous studies of various aluminosilicate minerals at 25°C all gave a value of reaction order n=0.3 (Brady and Walther, 1989; Ragnarsdottir, 1991). And that of albite and quartz at 70°C at basic pH, have similar dependencies. That is:

From these observations, it was suspected that the reaction order was similar for all aluminosilicate minerals at the same temperature (Carroll and Walther, 1989). The similarity of crystal structures of all aluminosilicates is a possible explanation for this. As introduced above, the surface species of many aluminosilicate minerals, including scolecite, are mainly >Si—O- groups and the same reaction of protonation/deprotonation takes place to produce the same surface complexes which determines the steady state dissolution rate. In this study, it seems that the results of the initial dissolution rate do not support these observations (Figure 9). There is no doubt that a big difference does exist between the initial dissolution rate and the steady state dissolution rate. However, as is shown in Figure 2, the initial dissolution rates are fastest and the rate decreases with time (the faster initial rates can be interpreted as a result of the thin wedges and edges which dissolve first (Ragnarsdottir, 1992)). The reaction order obtained by the steady state dissolution rates will not reach the same value observed in other studies. The reasons for this are not clear.
Figure 9: The dissolution rates of albite, quartz (Knauss and Wolery, 1986) and scolecite (this study) as a function of pH in basic solution at 70°C.
Generally speaking, the mean lifetime of scolecite decreases when temperature and pH rise (Table 5). As the temperature of the radioactive waste disposal repository can be elevated by the radioactivity of high-level radioactive waste, the lifetime of scolecite can be shorter than found in this study. Applying different temperatures and the calculated pre-exponential factor A (2.41x10⁻⁹ mol cm-2 s-1) obtained based on Si release to the Arrhenius Equation gives dissolution rates that were then applied to a hypothetical 1mm spherical scolecite crystal. The estimated lifetime of scolecite at temperatures higher than 100°C is shown in Figure 10. At 900°C, the lifetime of scolecite can be less than 5 years. Therefore, when scolecite is formed around the repository during the water-rock interaction, the heat generated in the waste container may greatly increase the dissolution rate of the scolecite together with many other minerals. Moreover, other researchers even argue that all zeolites will disappear at about 150°C, based on the observations from geothermal systems in Iceland (Kristmannsdottir and Tomasson, 1978).
Figure 10: The mean lifetime (log years) of scolecite against temperature.
Conclusion
From this study, it is concluded that, like other kinds of zeolites, the dissolution rate of scolecite increases with the pH in an alkaline solution. The initial dissolution rate ranges from approximately 10-14.5 moles cm-2s-1at pH 8 to 10-13.9moles cm-2s-1at pH 12 at 25°C. These values are very close to many other aluminosilicate minerals such as heulandite and quartz (Brady and Walther, 1990; Ragnarsdottir, 1992). However, compared to other types of zeolites, the dimensions of the channels in scolecite are smaller with a void fraction of 0.31, which determines its relatively low cation exchange capacity. Therefore, although it may still be considered, scolecite is not recommended as an ideal material to be used as a barrier in a radioactive waste repository package.
Because of its relatively low dissolution rate, scolecite has a long lifetime, up to 100,000 years in neutral pH at 25°C. However, the elevation of temperature can destabilize scolecite substantially. Therefore, if high temperatures are of concern for long term security considerations, more effort should be taken in designing the container for the radioactive waste with respect to the geological environment of the nuclear waste repository.
Acknowledgements
Many of the instructions and ideas for this study, especially concerning the experiments, were given by Dr. Elizabeth Bailey, University of Nottingham. I thank Darren Hepworth and John Corrie for helping me with the laboratory work.
Notes
[1] Lingchen Mao is now working at the B'Baun Medical Company in Shanghai and will be returning to the University of Nottingham for postgraduate study this September.
References
Barrer, R. M (1982),Hydrothermal Chemistry of Zeolites, London: Academic Press
Brady, P. V. and J. V. Walther (1989), ‘Controls on silicate dissolution rates in neutral and basic pH solutions at 25°C’, Geochimica et Cosmochimica Acta, 53, 2823-2830
Brady, P. V. and J. V. Walther (1990), ‘Kinetics of quartz dissolution at low temperatures’, Chemical Geology, 82, 253-264
Breck and Donald Wesley (1974), Zeolite Molecular Sieves: Structure, Chemistry, and Use, London: Wiley-Interscience
Carroll-Webb, Susan A. and John V. Walther (1988), ‘A surface complex reaction model for the pH-dependence of corundum and kaolinite dissolution rates’, Geochimica et Cosmochimica Acta, 52, 2609-2623
Casey, W. H. and G. Sposito (1992), ‘On the temperature dependence of mineral dissolution rates’, Geochimica et Cosmochimica Acta, 56, 3825-3830
Dal Bosco, S. M., R. S. Jimenez, W. A. Carvalho (2005), ‘ Removal of toxic metals from wastewater by Brazilian natural scolecite’, Journal of Colloid and Interface Science, 281, 424-431
Essington, M. E. (2004), Soil and water chemistry: an integrative approach, USA: Routledge
Gibb, F. G. F. (1999), ‘High-temperature, very deep, geological disposal: a safer alternative for high-level radioactive waste?’,Waste Management,19, 207-211
Hartman, R. L. and H. S. Fogler (2007), ‘Understanding the Dissolution of Zeolites’, Langmuir, 23, 5477-5484
Karnland, O., S. Olsson, U. Nilsson, P. Sellin (2005), ‘ Experimental study on changes of bentonite mineralogy and physical properties as a result of exposure to high pH solutions’, Clays in Natural & Engineered Barriers for Radioactive Waste Confinement, 2nd International Meeting, March 14-18, 2005, Tours, France Abstracts, 341-342
Knauss, K. and T. Wolery (1986), ‘Dependence of albite dissolution kinetics on pH and time at 25°c and 70°c’, Geochimica et Cosmochimica Acta, 50, 2481-2497
Krauskopf and Konrad Bates (1967),Introduction to Geochemistry, New York: McGraw-Hill
Langmuir, Donald (1997), Aqueous Environmental Geochemistry, New Jersey, USA: Prentice Hall
Lasaga, A. C., J. M. Soler, J. Ganor, T. E. Burch, and K. L. Nagy (1994), ‘Chemical weathering rate laws and global geochemical cycles’,Geochimica et Cosmochimica Acta,58, 2361-2386
Morse, J. W. and R. S. Arvidson (2002), ‘The dissolution kinetics of major sedimentary carbonate minerals’, Earth-Science Reviews,58, 51–84
Mindat.org, The website of Mineral Data, http://www.mindat.org/min-3594.html, accessed 21 April 2008
Nagy, K. L. and A. C. Lasaga (1991), ‘Dissolution and precipitation kinetics of gibbsite at 80°C and pH 3: The dependence on solution saturation state’, Geochimica et Cosmochimica Acta,56, 3093-3111
Nirex Report No: N/16 (2001), ‘The Scientific Foundations of Deep Geological Disposal’
Nirex Report N/041 (2002), ‘Radioactive Wastes in the UK, A Summary of the 2001 Invertory’
Nirex Report No: N/122 (2005), ‘The Viability of a Phased Geological Repository Concept for the Long-term Management of the UK’s Radioactive Waste’
Ragnarsdottir, K. V. (1992), ‘Dissolution Kinetics of Heulandite at pH 2-12 and 25°C ’, Geochimica et Cosmochimica Acta, 57, 2439-2449
Rose, N. M. (1991), ‘Dissolution rates of prehnite, epidote, and albite’, Geochimica et Cosmochimica Acta, 55, 3273-3286
Sato, T., M. Kuroda, S. Yokoyama, K. Fukushi, T. Tanaka, S. Nakayama(2003), ‘Mechanism and kinetics of smectite dissolution under alkaline conditions’, Geochimica et Cosmochimica Acta, 67, 415-415
Savage, D., C. Walker, R. Arthur, C. Rochelle, C. Oda, H. Takase (2007), ‘Alteration of bentonite by hyperalkaline fluids: A review of the role of secondary minerals‘, Physics and Chemistry of the Earth,32, 287-297
Savage, D., C. Rochelle., Y. Moore., A. Milodowski., K. Bateman., D. Bailey. and M. Mihara (2001), ‘Analcite reactions at 25-90 in hyperalkaline fluids’, Mineralogical Magazine,65, 571-687
Trotignon, L., H. Peycelon, X. Bourbon (2006), ‘Comparison of performance of concrete barriers in a clayey geological medium’, Physics and Chemistry of the Earth,31, 610-617
Wilkin, R. T. and H. L. Barnes (1998), ‘Solubility and stability of zeolites in aqueous solution: I. Analcime, Na-, and K-clinoptilolite’, American Mineralogist, 83, 726-761
Wolff-Boenisch, D., S. R. Gislason, E. H. Oelkers, C. V. Putnis (2004), ‘The dissolution rates of natural glasses as a function of their composition at pH 4 and 10.6, and temperatures from 25 to 74°C’,Geochimica et Cosmochimica Acta, 68, 4843–4858
Yamaguchi, T., Y. Sakamoto, M. Akai, M. Takazawa, Y. Iida, T. Tanaka, S. Nakayama (2007), ‘Experimental and modelling study on long-term alteration of compacted bentonite with alkaline groundwater’, Physics and Chemistry of the Earth, 32, 298-310
Yamamoto, S., S. Sugiyama, O. Matsuoka, K. Kohmura, T. Honda, Y. Banno and H. Nozoye (1996), ‘Dissolution of zeolite in acidic and alkaline aqueous solutions as revealed by AFM Imaging’, Journal of Physical Chemistry, 100, 18474-18482
Zhang, H. and P. R. Bloom (1999), ‘Dissolution Kinetics of Hornblende in Organic Acid Solutions’, Soil Science Society of America Journal, 63, 815-822
To cite this paper please use the following details: Mao, L. (2009), 'Dissolution Kinetics of Scolecite in Alkaline Environments', Reinvention: a Journal of Undergraduate Research, Volume 2, Issue 1, http://www2.warwick.ac.uk/go/reinventionjournal/issues/volume2issue1/mao Date accessed [insert date]. If you cite this article or use it in any teaching or other related activities please let us know by e-mailing us at Reinventionjournal at warwick dot ac dot uk.
© Reinvention: a Journal of Undergraduate Research (2009). Full copyright remains with the author.