Start-ups, Small Firms and the Industry: An Empirical Investigation of the Determinants of Small New Firm Survival
Viktorie Sevcenko[1], Departments of Philosophy, Politics and Economics, University of Warwick
Abstract
This study examines the relative differences in failure hazard between groups of business units using a set of industry- and firm-specific covariates, where the groups are defined according to their age and size. The data used in this paper comes from the Business Structure Database, provided by the Office for National Statistics. To analyse the exit hazard, a non-parametric survival model, known as the Cox Proportional Hazards Model, is employed. The study finds significant differences in the effects of most industry- and firm-specific across both size and time, where the covariate effects for small size and young age, as well as older age and large size were similar. These results suggest important differences between small start-ups and other, small and medium-sized businesses, yielding support to the idea that the interests of start-ups may not be easily represented by a single, small-business interest group.
Keywords: New firms, small firms, survival, size, industry characteristics
Disclaimer
This work contains statistical data from ONS which is Crown copyright and reproduced with the permission of the controller of HMSO and Queen's Printer for Scotland. The use of the ONS statistical data in this work does not imply the endorsement of the ONS in relation to the interpretation or analysis of the statistical data. This work uses research datasets which may not exactly reproduce National Statistics aggregates.
Introduction
'A riddle wrapped in a mystery inside an enigma'
(Acs, Carlsson and Thurik,1996: 8)
The Federation of Small Businesses (FSB) is one of the most influential interest groups, representing over 200,000 small enterprises in the UK and Ireland (FSB, 2011). The FSB claims to represent a very wide range of business types and industries, all of whom have only one key feature in common: their size. However, the group is run by and for the existing members; its income comes from companies with the ability to pay the fees. They claim to focus on all existing and nascent entrepreneurs, but the purpose of lobbying is mainly to prevent 'market failure' and protect existing firms from excessive competition. In other words, business interest groups form in order to inform the government of the problems its members face and to rectify what they perceive as 'unfair treatment' by either their competitors or government regulation. Given the relatively small percentage of entirely new market entrants joining the FSB (FSB, 2010), it may be that the FSB will not be able to represent the start-ups as effectively as existing firms. In fact, an excessive encouragement of new entry would most likely upset its existing members, who are seeking protection for their businesses. This study will therefore test the hypothesis that new and small start-up enterprises differ significantly from more established small firms in terms of their reactions to industry characteristics.
The rest of this paper is organized into six parts. The next three review the existing research into new and small firm performance, and describe the data and the method used. The following three describe the chosen variables, discuss the results obtained and conclude.
Literature Review
This study builds on three decades of research into small firm survival and post-entry performance (see Geroski, 1995, for a short summary). One of the essential conclusions of these studies is that new and small firms are fundamentally different from their older and larger counterparts in terms of their performance and survival rates. Small firms find it more difficult to survive in the first few years of their existence due to having access to fewer resources in difficult times, having fewer opportunities to downsize and cut costs, and frequently due to having less market experience. However, the extent to which these disadvantages diminish within the first decade of existence and with increasing size is not always clear.
Jovanovic (1982) finds that most initial company learning is of a passive nature, whereby firms only learn of their actual abilities post-entry. The choice of exit is therefore dependent on whether or not their abilities facilitate or hinder their survival, with little room for adaptation. This interpretation is more plausible for explaining rapid exit, since these firms would not have had enough time to adapt to their new environment. However, for firms surviving past their first couple of years, this explanation is less convincing. Instead, existing firms have likely had to adapt to their changing environment and therefore built a range of adaptive capabilities.
Therefore, if new entrants have not yet developed these capabilities, the first few years are the most difficult in terms of survival, and consequently the easiest years in which existing companies can prompt a new entrant to exit. Based on the above reasoning, if new entrants are shown to exhibit different reactions to industry characteristics than existing companies, the latter can use this information to influence policy in their favour, exacerbating the relevant industry characteristics. This study will attempt to examine whether or not the effects of industry entry rates, average entry size and industry size vary for firms of different age and size.
In addition, in line with existing literature, control variables such as ownership structure, legal status and mean industry employment will be used (e.g. Audretsch, 1995; Mata, Portugal and Guimaraes, 1995).
Data
Defining a small firm is a difficult and imprecise process. The UK government does not have a central body registering all enterprise; instead, a number of authorities exist, each designed to serve a specific purpose. One of the most widely used sources is the VAT registration directory, but census statistics, the labour force survey and company accounts (among others) could also be employed. Each of these will contain some firms not listed in other sources and vice versa, since each firm may or may not be required to register in a given source. For instance, the VAT threshold keeps a large number of enterprises out of this directory, registering fewer than two million firms out of the total of roughly 4.8 million in the UK at present. The FSB defines a small firm as one employing fewer than 250 employees, and this paper will adopt this definition.
The data used in this study comes from the Business Structure Database (BSD), which contains enterprises registered for VAT and/or PAYE, covering nearly 99% of the private enterprise output in the UK. The BSD is based on the Inter-Departmental Business Register (IDBR) for Research drawing from the following administrative sources (ONS):
-
HMRC;
-
Dunn and Bradstreet – information on business ownership links;
-
ONS surveys;
-
Companies House – quarterly.
The BSD is then a yearly snapshot of the two million companies registered on the IDBR. It provides clear data on firm birth (new firm registrations for VAT and/or for PAYE) and death (firm de-registrations from VAT), without double counting (i.e. the same business units are not counted twice, even if they fall into a period of inactivity or are acquired by another firm). The database also contains information on each firm's location, its classification code (Standard Industry Classification (SIC), 2003), the number of local and reporting units[2]within the enterprise, and number of employees. The data includes all companies that have ever entered the database, even if they are no longer alive. It therefore serves as the ideal base database for the purposes of the paper.
The samples used in this study are two entry cohorts, entering either between 1 January 1999 and 31 December 1999 or 1 January 2001 and 31 December 2001, examined in their likelihood of surviving for one, three, five or eight years, depending on the cohort. These years were chosen due to them being empirically and theoretically important for examining the likelihood of survival (Storey and Greene, 2010), and in order to partially control for cohort-specific and economy-wide effects that might have skewed the results somewhat. The selected cohorts span all 2-digit SIC industry classifications. The selected samples include all firms incorporated in the given year that were either already dead or still alive by the end of 2009. Both of the samples include only those firms employing fewer than 250 employees, so as to limit the sample to only those firms the FSB represents. The firms are also pooled from all areas of the UK to gain maximum representation. From the total database, the selection process, which eliminated firms with 250 or more employees, as well as firms incorporated in years other than 1999 or 2001, left two samples of 284,049 firms (the 2001 entry cohort) and 206,212 firms (the 1999 entry cohort).
However, the BSD has a number of limitations. It does not classify exit easily, which is problematic given that much of firm de-registration is the result of firms merging together, firms being acquired by others or the entrepreneurs finding another, more lucrative position (Storey, 1997). In fact, most exits do not occur due to genuine bankruptcy, and unfortunately, many other studies are affected by this same problem (Mata and Portugal, 1994; Mata, Portugal and Guimares, 1995). However, one may also argue that the vast majority of small firms are not likely to be bought by another for a sum far beyond the market value of its assets. Further reasons for exit, such as finding a more profitable opportunity or retiring can also be considered along similar lines, but this of course, remains an important limitation of the data.
Furthermore, as with any industry classification, diversified firms are difficult to analyse due to their presence in a number of SIC groups simultaneously. Even for those specialising in a single industry, the SIC codes do not define the companies well in terms of who their competitors are and exactly what products they produce or should produce. This has important consequences for variables attempting to capture the level of competition, size of entry, minimum efficient scale of operations and frequency of entry in a single industry. Namely, the magnitude of variables used may be diluted. Unfortunately, the SIC method remains largely the only feasible one for carrying out research on this scale.
Method
Simple Ordinary Least Squares and other linear methods of estimation are insufficient when it comes to analysing the length of time for which firms remain in a market (Mata and Portugal, 1994). These models do not take into account censored events, and given the nature of survival analysis, some firms (observations) will inevitably be censored due to the event (failure) not occurring for all within the given time frame (Mata and Portugal, 1994). In other words, some firms in our sample will have survived throughout; these observations are known as 'right-censored'. A possible estimation technique for the baseline hazard rate of failure is known as the Kaplan-Meier estimator. This is a graphic estimation without any covariates, tied to which is the method of life-table analysis, where the survival rates of firms are listed for each point in the duration of the analysis. The Kaplan-Meier estimator is an important tool for a preliminary examination, but for the purposes of this paper, a number of covariates will be tested in their influence on the likelihood of survival.
To account for this, the paper will use survival analysis (Kleinbaum, 1996), utilising the non-parametric Cox Proportional Hazards Model, a common model for this type of analysis. The model has the following function:
Where T is the duration of the firm's existence, f(t) is the probability density function and S(t) is the survival function. The estimated Cox Proportional Hazards Model (Cox, 1972) will then be:
Where h(t) is the baseline hazard function, X is a vector of explanatory variables and β is a vector of parameters. The baseline hazard is estimated by setting X equal to 0. Accordingly, the effect of a unit change in a covariate is to produce a constant proportional change in the hazard rate (Mata and Portugal, 1994, 231). Put another way, the effect of each covariate is to act multiplicatively on h0(t). The non-parametric nature of the model allows one not to have to define a specific distribution of its baseline hazard, thereby not risking misspecification (Cox, 1972; Mata and Portugal, 1994).
However, the assumption made to allow this is that of a 'constant effect of a covariate on survival over the entire follow-up period' (Zhang and Huang, 2004: 267). This means that each covariate will have the same effect on the dependent variable throughout the entire length of analysis. This, of course, may not be true for all firms. The assumption is appropriate in this analysis because the examined variables are not likely to change in their impact throughout time or are assumed to have similar changes in their effect on all firms (a more detailed discussion will follow in the Variables section). However, non-parametric methods tend to produce less accurate results. Thus, if we are aware of the underlying distribution of the hazard rates for our sample, a parametric method is usually a better predictor (Akritas, 2004), but such analysis is beyond the scope of this paper.
Finally, the hazard rate is closely related to duration dependence. Duration dependence shows the changes in the hazard rate over time. Dependence may be positive or negative, meaning that the level of hazard (likelihood of failure) is rising over time for all firms that are still in existence at each given point in time. Negative duration dependence refers to the opposite. Therefore, dh(t)/dt > 0 or dh(t)/dt<0. This dependence is closely linked to unobserved heterogeneity in firms (Mata and Portugal, 1994), since it shows a certain 'drift' beyond the explanatory power provided by the covariates.
Variables
Seventeen variables were used in this study, grouped into two groups: business-unit effects and industry effects. Business-unit effects relate to specific characteristics exhibited by the business units themselves, such as their size and legal type. Industry-level effects may be the size of the industry, the average size of companies within the industries or the net entry of firms. Table 1 summarises the variables, stating their mean values, standard deviations and their minimum and maximum values. For some the values for 1999 and 2001 differ; for others, the values are averaged out across all industries and all years available in the database, and therefore, remain the same for both cohorts.
The variable ln(Employent) stands for the natural logarithm of the number of employees each business unit possess at the year of entry. The variables Company, Sole Proprietor and Partnership are dummy variables created using the categorical variable Status within the BSD. Status denotes the legal type of each company and each dummy variable takes the value of 1 if the company is of the given type, and 0 otherwise. More than half of the dataset is composed of private companies, with a further third composed of sole proprietors and a tenth containing partnerships. These variables account for the differences in registration and bankruptcy regulation, as well as in access to financial resources (Storey and Greene, 2010), and we should expect to see limited liability companies experience a lower failure hazard than sole proprietors and partnerships.
Industry Birth 2001 and Industry Birth 1999 stand for the average number of new entrants into each industry within the given year. The number of new entrants does not signal anything significant on its own. However, when combined with the Industry Size, Average and Absolute Net Entries of companies within the industry, as well as the Average Entrant Size (the average number of employees a new firm in each industry possesses), the number of entrants begins to be important. The greater the number of new entrants, and the lower the net industry entry is, the more likely it is that the firm will not survive. If entry is high and the industry size is large, but average net entry is positive and relatively high, new firms may be able to accommodate themselves easier due to the market having extra capacity.
The 25th and 75th Percentiles denote the mean number of employees, by industry, employed within the 25th or 75th percentiles of companies. In other words, taking the 25 percent of smallest firms in the industry, how many employees does an average firm within each industry employ on average? For the 75th Percentile, the reasoning is similar, and together the two variables show the average spread of firm sizes within each industry. The expectation is that those smallest in relation to their industries will, on average, face the most difficulties surviving. The variables are dummy variables, with a 1 signaling that a given business unit is operating within an industry with the 25th Percentile employing, on average, fewer than 2 employees and the 75th Percentile employing more than 15 employees, and 0 signaling otherwise. The values obtained the dummy variables are the median values in each original variable. In other words, two was the median value for the 25th Percentile and fifteen was the median value for the 75th Percentile.
| Variable | Mean | Standard Deviation | Minimum | Maximum |
|---|---|---|---|---|
| Company | 0.547628 | 0.497727 | 0 | 1 |
| Sole Proprietor | 0.294826 | 0.455965 | 0 | 1 |
| Partnership | 0.113844 | 0.317622 | 0 | 1 |
| Industry Birth 2001 | 13298.96 | 9988.086 | * | * |
| Industry Birth 1999 | 8669.821 | 6499.013 | * | * |
| Mean Industry Employment | 9.355274 | 7.700465 | * | * |
| ln(Employment) | 0.8827935 | 1.007503 | 0 | 9 |
| 25th Percentile | 0.1643911 | 0.370631 | 0 | 1 |
| 75th Percentile | 0.2087344 | 0.406405 | 0 | 1 |
| Average Net Industry Entry | 1384.967 | 4208.590 | * | * |
| Absolute Net Industry Entry | 2875.080 | 3371.091 | * | * |
| Foreign Ownership | 0.976282 | 0.152171 | 0 | 1 |
| Owned by a Holding Company | 0.094671 | 0.292761 | 0 | 1 |
| Multiple Business Units | 0.184649 | 0.388013 | 0 | 1 |
| Average Entry Size 2001 | 3.608627 | 2.939370 | * | * |
| Average Entry Size 1999 | 7.732510 | 34.79819 | * | * |
| Industry Size (/1000) | 110.8407 | 83.21184 | * | * |
Table 1: Description of Variables (Source: ONS)
[* confidential data, which has been omitted at the request of the ONS]
Finally, Owned by a Holding Company and Multiple Business Units are included to show whether or not the firm belonged to a larger business, and if so, if this business also belonged to a holding company. Multiple Business Units takes the value of one if there are other business units and therefore the given unit is owned by a larger business, and zero otherwise. Owned by a Holding Company takes the value of one if this is the case and zero otherwise. The effects on survival are dependent on the relative strengths of two opposing factors: (1) greater access to capital and expertise as a result of being part of a large business, and (2) greater risk of being sold off to another company or closed down if underperforming, due to higher opportunity costs of the assets employed. Fewer than one in five companies in the sample are owned by larger firms with multiple business units, and fewer than one in ten are owned by a holding company.
Results and Discussion
Descriptive Statistics
Turning to the BSD firm-level data, it is helpful first to analyse the rates of survival each year within the main (2001) cohort. Using a method known as Life Table Analysis, Table 2 presents the rates of survival, cumulative failure and exit hazard for each year that the sample is available. Only 177,550 observations are included, leaving 123,397 firms out due to the table only including those firms, which have died in any of the years from 2002 to 2007, with the last 1882 firms exiting in 2008, but counted as lost in the table. As shown, the Hazard rate and Cum. Failure increase with each year, without slowing down the rate of increase.
| Interval | Beginning Total |
Deaths | Lost | Survival | Cum. Failure | Hazard |
|---|---|---|---|---|---|---|
| 2001 - 2002 | 177550 | 38874 | 0 | 0.7811 | 0.2189 | 0.2459 |
| 2002 - 2003 | 138676 | 40738 | 0 | 0.5516 | 0.4484 | 0.3443 |
| 2003 - 2004 | 97938 | 32751 | 0 | 0.3671 | 0.6329 | 0.4015 |
| 2004 - 2005 | 65187 | 27177 | 0 | 0.2141 | 0.7859 | 0.5267 |
| 2005 - 2006 | 38010 | 21497 | 0 | 0.0930 | 0.9070 | 0.7885 |
| 2006 - 2007 | 16513 | 14631 | 0 | 0.0106 | 0.9894 | 1.5908 |
| 2007 - 2008 | 1882 | - | 1882 | - | - | - |
Table 2: Life Table Analysis (Source: ONS)
Graph 1 shows the firms failing in each year as a percentage of the total sample (with the 123,397 firms still alive added back in). Nevertheless, in contrast to previous studies (Mata and Portugal, 1994; Wagner, 1994), death rates do not seem to reach a significant plateau in terms of cumulative failure by 2007, but keep increasing at a relatively steady rate throughout the entire first 7 years of the cohort's life.
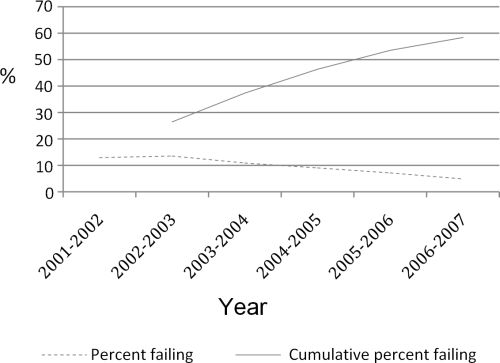
Graph 1: Percent Failing – Yearly and Cumulative (Source: ONS)
Regression Results
For the 2001 entry cohort, exit hazard was estimated for 1 year, 3 years, 5 years and for all exit years combined. For the 1999 entry cohort, exit hazard was estimated for surviving for 3 years, 5 years and 8 years[3]. Finally, the 2001 cohort was also separated into two groups: small business units (fewer than 50 employees) and medium business units (50 employees or more), and regressions were carried out on the same variables, looking for possible differences in effects depending on size. The tables below presents the Cox Proportional Hazards Model results for each length of time observed for both cohorts. As the tables show, nearly all of the included variables were significant at the one percent level. One can also gather the opposite trends in the effects of covariates on the exit hazard over time.
As expected, ln (Employment) decreases in magnitude over time, with its impact on the one-year exit hazard rate resembling very closely findings in other studies (Mata and Portugal, 1994). The negative sign means that the larger the firm, the lower the hazard of exit is. This effect is also reflected in the large differences between small and medium-sized companies (Table 5).
| 2001 Entry Cohort | Exit Hazard by Years of Survival | |||
|---|---|---|---|---|
| Variables | 1 Year | 3 Years | 5 Years | 1 - 5 Years |
| ln(Employment) | -0 .249*** | -0.131*** | -0.082*** | 0.141*** |
| Sole Proprietor | 0.458*** | 0.084*** | -0.049*** | 0.136*** |
| Partnership | 0.526*** | 0.173*** | -0.040 | 0.203*** |
| Subsidiary | -1.561*** | -1.448*** | -1.961*** | -1.579*** |
| Holding Owned | 0.580*** | 0.202*** | 0.0936*** | 0.272*** |
| Mean Ind. Emp. | 0.013*** | 0.00723*** | 0.0105*** | 0.0099*** |
| Industry Size | -0.0035*** | -0.00516*** | -0.00512*** | -0.0042*** |
| Industry Birth | 0.000046*** | 0.000041*** | 0.000038*** | 0.000040*** |
| 75th Percentile | 0.102*** | 0.107*** | 0.108*** | 0.0998*** |
| 25th Percentile | -0.297*** | -0.169*** | -0.238*** | -0.244*** |
| Absolute Net Entry | -0.000022*** | 0.000076*** | 0.000118*** | 0.0000418*** |
| Average Net Entry | -0.000014** | -0.000077*** | -0.000088*** | -0.000046*** |
| Foreign Owner | 0.101 | -0.535*** | -0.242*** | -0.340*** |
| Avg. Entry Size | -0.00455 | -0.014*** | -0.00906*** | 0.00553*** |
| No. of Observations | 284049 | 284049 | 284049 | 284049 |
Table 3: Regression Results for the 2001 Cohort (Source: ONS)
[*** Significant at the 1% level and ** Significant at the 5% level]
The status dummy variables omit Company, so as to show the effects of being any legal type other than a private company. The dummy variables show a predominately decreasing magnitude of effects across time. Therefore the benefits of registering as a company diminish over time. This suggests that as the company ages, its survival is affected less by its legal status and more by other factors, making it presumably less interested in incorporation and hiring processes regulation.
The effects of Subsidiary and Holding Owned are of opposite signs, tend in opposite directions and are both significant at the one percent level. Holding companies tend to be large, diversified groups, for whom the opportunity cost of capital is relatively high, while extensive experience in a given industry or geographical area is often low. To enter a new market, they tend to acquire business units as an investment opportunity rather than business development (Grant, 2010). This means that if problems arise, and the new business unit is not as profitable as was originally expected, or it does not integrate well with the rest of the company, it is more likely to be sold off or closed down, and these decisions are most often made at the early stage of the unit's life (Libczynski and Wilson, 2001). For an enterprise with multiple business units, the extra unit will usually be within the broad industry definition and therefore, within the scope of the enterprise's expertise. The longer the business unit remains in business for, the more it will be integrated into the rest of the business, and the harder the enterprise will try to maintain its existence.
The industry-level variables, Industry Size, Mean Industry Employment, Industry Birth and the 25th and 75th Percentiles, showed the following picture: all things being equal, as industry size increases, the likelihood of exit decreases, whereas industry birth has the opposite effect. Industry Size increased in importance over time, while Industry Birth decreased, and similar changes occurred with changing size. These effects were fully expected, since increasing industry size means that the industry is large, and therefore, able to accommodate more firms. The larger size becomes even more important as the firm ages, since it is able to grow and take over the market share of the other new firms that have failed in the meantime (Audretsch, 1995). The positive and decreasing effect of industry birth is straightforward: Industry Birth measures the number of entrants in each industry in the year of entrance for each cohort, therefore the greater the number of entrants that year, the greater the competition among the new firms for survival in the beginning. However, with time, the less efficient business units exit and the impact of the original entry cohort size on competition and survival decreases.
| 1999 Entry Cohort | Exit Hazard by Years of Survival | ||
|---|---|---|---|
| Variables | 3 Years | 5 Years | 8 Years |
| ln(Employment) | -0.134*** | -0.110*** | -0.0301*** |
| Sole Proprietor | 0.157*** | 0.0493*** | -0.206*** |
| Partnership | 0.122*** | 0.0927*** | -0.206*** |
| Subsidiary | -0.820*** | -1.054*** | -2.125*** |
| Part of a Holding | 0.344*** | 0.010 | -0.580*** |
| Mean Ind. Emp. | 0.007*** | 0.0107*** | 0.008*** |
| Industry Size | -0.005*** | -0.00510*** | -0.00384*** |
| Industry Birth | 0.0000432*** | 0.0000334*** | 0.00000870 |
| 75th Percentile | 0.132*** | 0.182*** | 0.107*** |
| 25th Percentile | -0.197*** | -0.271*** | -0.230*** |
| Absolute Net Entry | -0.0000223*** | 0.000188*** | 0.000247*** |
| Average Net Entry | -0.0000141** | -0.000119*** | -0.00016*** |
| Foreign Ownership | -0.211*** | -0.332*** | -0.207* |
| Avg. Entry Size | -0.001*** | -0.00109*** | -0.0006 |
| No. of Observations | 206212 | 206212 | 206212 |
Table 4: Regression Results for the 1999 Cohort (Source: ONS)
[*** Significant at the 1% level, ** Significant at the 5% level and * Significant at the 10% level]
The 25th and 75th Percentiles also show opposite trends and signs both across time and size. This means that operating within an industry where average business unit employment is less than 2 employees within the 25th percentile leads to a decreasing negative effect on the hazard, whereas being part of an industry where firms in the 75th percentile employ more than 15 workers leads to a slightly increasing positive effect on the hazard. The explanation behind these results is that an a large proportion of small firms within an industry increases the chances of survival for a small firm, since on average, across all years, the industry seems to accommodate many of them. If most firms in the industry employ a rather high average number of employees, however, the chances of survival for a small entrant decrease, due to minimum efficient scale usually being higher.
However, in order to understand the full impact of these results, they must also be combined with net entry into the industry and the average size of entrants. The greater the absolute net entry, the larger the average year-on-year changes in the number of firms within an industry, but on its own does not mean much, since the industry could be becoming more concentrated, declining or instead, growing. When combined with average net entry, which includes negative values for the declining/concentrating industries and increases the chances of survival with more positive values (growing industries), absolute entry means that the net changes are only helpful in the first year of a company's life, but otherwise exhibit positive and highly fluctuating effects. This means that only new entrants can truly take advantage of the large changes in net entry, either due to other firms rapidly exiting and freeing up market share or due to the industry growing rapidly and therefore accommodating many new entrants. However, as the firm ages, large fluctuations in next entry do not seem to be helpful, but instead, disrupt the business unit's performance.
| Exit Hazard by Size | ||
|---|---|---|
| Variables | Small | Large |
| ln(Employment) | -0.199*** | -0.0831*** |
| Sole Proprietor | 0.119*** | 0.0906*** |
| Partnership | 0.195*** | 0.226*** |
| Subsidiary | -2.333*** | -1.054*** |
| Part of a Holding | -0.768*** | 0.010 |
| Mean lnd. Emp. | 0.013*** | 0.0107*** |
| Industry Size | -0.00520*** | -0.00429*** |
| Industry Birth | 0.0000478*** | 0.0000334*** |
| 75th Percentile | 0.0513*** | 0.126*** |
| 25th Percentile | -0.266*** | -0.285*** |
| Absolute Net Entry | 0.0000736*** | 0.0000473*** |
| Average Net Entry | -0.0000624** | -0.000488*** |
| Foreign Ownership | -0.983*** | -0.177*** |
| Avg. Entry Size | -0.00528*** | 0.00662*** |
| No. of Observations | 168379 | 115670 |
Table 5: Regression Results by Firm Size (Source: ONS)
[*** Significant at the 1% level and ** Significant at the 5% level]
Finally, Foreign Ownership and the Average Entry Size have negative and increasing effects on the hazard, although the effects differ for different sizes. This result is rather surprising, because first of all, it is insignificant immediately upon entry in the 2001 cohort, which seems counter-intuitive since one would expect this variable to be most significant in the year of entrance, and generally, to follow the rationale behind general firm size effects. However, the explanation may lie in the fact that average entry size actually includes the effects of the individual unit's size, in the sense that, the larger the average entry size within a given industry, the more likely it is that the given firm is itself somewhat large, and therefore, the more likely it will survive. This would also explain why the variables change in sign for differently sized companies, for larger firms will face greater competition if entrants are also large, whereas for smaller firms, this effect is opposite, as described above. However, the problem may also lie in complex correlations between average entry size and other included variables, thereby average entry size capturing some other variable' s effect.
Conclusion
The results point to the differences in effects of different variables between small and large firms, as well as between start-ups and older firms. As expected, new firms react similarly to small firms, and older firms react similarly to larger firms. However, the study would first of all be greatly improved by assigning each firm to its 4-digit SIC industry definition, rather than to a 2-digit one, thereby increasing the chances of identifying relevant competitors accurately. Second, more variables could be added to the dataset, in order to control for economy-wide effects, as well as corporate-parent effects (holding company effects). Lastly, the study could also be improved by examining the effects of current variables or time-varying covariates, so as to capture the differences in effects of stationary and dynamic effects. Nevertheless, the findings yield support for the initial hypothesis: that small start-ups react differently to industry characteristics than do established small firms, and that perhaps, the activities of the FSB may not apply to both groups in the same way. However, further explicit investigation of the FSB's lobbying activities is necessary to provide more conclusive answers.
Acknowledgements
I would like to thank Professor Wyn Grant and Professor Dennis Leech for their support and very helpful suggestions, and Dr Catherine Hanley without whom this project would not have taken place. Finally, I would also like to thank the Reinvention Centre for enabling me to undertake this study and supporting me financially.
List of Illustrations
Graph 1: Description of Variables
List of Tables
Table 1: Description of Variables (source: ONS)
Table 2: Life Table Analysis (source: ONS)
Table 3: Regression Results for the 2001 Cohort (source: ONS)
Table 4: Regression Results for the 1999 Cohort (source: ONS)
Table 5: Regression Results by Firm Size (source: ONS)
Notes
[1] Victoria graduated from the University of Warwick in July 2010 with a degree in Philosophy, Politics and Economics and is currently reading for an MSc at Imperial College London. She is hoping to continue her studies next year and pursue a PhD in Management.
[2] Local units are the smallest possible business units, and data collected on them from the reporting units, larger groups of local units (if there are any). The data used in this study is on the local-unit level.
[3] For each survival year, only those firms are examined, which have survived until the previous year. For instance, the 5 Years regression only analyses those firms which have survived for 4 years, and may or may not last an extra year.
References
Acs, Z., B. Carlsson and R. Thurik (1996), Small Business in the Modern Economy, Oxford: Blackwell
Akritas, M. G. (2004), 'Nonparametric Survival Analysis', Statistical Science, 19 (4), 615-23
Audretsch, D. (1995), 'Innovation, growth and survival', International Journal of Industrial Organization, 13, 441-57
Cox, D. (1972), 'Regression Models and Life-Tables', Journal of the Royal Statistical Society, 34 (2), 187-220
Federation of Small Businesses (2005), Budget Submission 2005, available at http://www.fsb.org.uk/, accessed 20 September 2010
Federation of Small Businesses (2010), The FSB-ICM Annual Report, available at http://www.fsb.org.uk/, accessed 20 September 2010
Federation of Small Businesses (2011), About, available at http://www.fsb.org.uk/, accessed 1 July 2011
Geroski, P. A. (1995), 'What Do We Know About Entry?', International Journal of Industrial Organization, 13, 421-40
Grant, R. M. (2010), Contemporary Strategy Analysis, 7th ed., Sussex: Blackwell
Grant, W. (1993), Business and Politics in Britain, 2nd ed., London: Macmillan
Lipczynski, J. and J. Wilson (2001), Industrial Organization: An Analysis of Competitive Markets, Essex: Pearson Education
Jovanovic, B. (1982), 'Selection and the evolution of industry', Econometrica, 50 (3), 649-70
Kleinbaum, D. (1996), Survival Analysis: A Self-Learning Text, New York: Springer-Verlag
Mata, J. and P. Portugal (1994), 'Life Duration of New Firms', The Journal of Industrial Economics, 42 (3), 227-45
Mata, J., P. Portugal and P. Guimaraes (1995), 'The survival of new plants: Start-up conditions and post-entry evolution', International Journal of Industrial Organization, 13, 459-81
Schmalensee, R. (1985), 'Do Markets Differ Much?', American Economic Review, 75 (3), 341-51
Storey, D. J. (1997), Understanding the Small Business Sector, London: Thomson Business Press
Storey, D. J. and F. J. Greene (2010), Small Business and Entrepreneurship, London: Pearson
Verbeek, M. (2009), A Guide to Modern Econometrics, 3rd ed., West Sussex: John Wiley and Sons Ltd
Wagner, J. (1994), 'The post-entry performance of new small firms in German manufacturing industries', Journal of Industrial Economics, 62, 141-54
Zhang, H. and C. Huang (2004), 'Nonparametric Survival Analysis on Time-Dependent Covariate Effects in Case-Cohort Sampling Design', unpublished report, Concordia College and North Dakota State University, available at http://www.cord.edu/faculty/zhang/cc-technicalReport.pdf, accessed 30 November 2010
To cite this paper please use the following details: Sevcenko, V. (2011), 'Start-ups, Small Firms and the Industry: An Empirical Investigation of the Determinants of Small Firm Survival', Reinvention: a Journal of Undergraduate Research, Volume 4, Issue 2, http://www.warwick.ac.uk/go/reinventionjournal/issues/volume4issue2/sevcenko Date accessed [insert date]. If you cite this article or use it in any teaching or other related activities please let us know by e-mailing us at Reinventionjournal@warwick.ac.uk