Fermentative Hydrogen Production from Molasses Using Pure and Co-cultures of Clostridium butyricum and Clostridium beijerinckii by Batch Study
Mohit Santilal[1], Department of Molecular and Applied Biosciences, University of Westminster
Abstract
This study investigated the effect of hydrogen production from molasses using pure and co-cultures of Clostridium beijerinckii (NCIMB-6444) and Clostridium butyricum (NCIMB-9578).
Fermentative hydrogen production from waste feedstocks is considered to be a promising source of renewable energy in the future. Pure strains of bacteria are lacking in diverse metabolic pathways, whereas co-cultures with well-defined strains can potentially enhance the hydrogen production process from waste feeds.
Batch fermentation in serum bottles was conducted in order to determine the total accumulative hydrogen gas, biomass concentration, and pH and glucose consumption in four days of fermentation. The co-culture was further scaled up to a 5-litre fermenter. One-way ANOVA and T-tests showed a significant difference in hydrogen production between pure and co-culture.
The co-culture produced the greatest volume of hydrogen gas, at 46.7 ml, but it did not significantly increase yields. Hydrogen production decreased by 4.9-1.6 fold in all the cultures due to low pH (4.2-5.2) and volatile fatty acids (acetic acid 2.2-1.65g/l, butyric acid 4.87-3.47g/l). The highest dead cell count of 3.7x10⁸ cells/ml suggested that pH was inhibitory. The scale-up showed a marked increase in the hydrogen production rate from 12.82 ml/l/h to 23.48 ml/l/h in 24 hours. This study suggested that molasses can be used as a cheaper carbon source for generating hydrogen.
Keywords: Fermentative hydrogen production, biofuel, co-culture, Clostridium spp, molasses.
Introduction
Fossil fuels (e.g. petroleum, oil, coal) are consumed extensively in the modern world to fulfil energy demands, but this has led to life-threatening conditions and to detrimental impacts on our environment, including global warming and climate change (Azbar and Levin, 2012).The increased utilisation of fossil fuels over recent years has rapidly released greenhouse gases into the atmosphere; this has disrupted the pool size and balance of biogeochemical cycles (e.g. the carbon and nitrogen cycles), resulting in a depletion of the ozone layer and an increased incidence of pollution and acid rain (Azbar and Levin, 2012). Global carbon emissions have increased by 1.4% and had reached 34.5 billion tonnes in 2012. Carbon dioxide was a major constituent of the emissions contributing to the greenhouse effect, of which 57% was from combustion of fossil fuels (Netherlands Environmental Assessment Agency, 2013). The consumption of petroleum-based fuels is predicted to rise by 80% in the next 30 years (EIA, 2013 and European Commissions, 2014). In addition, with the availability of fossil fuels diminishing and stocks depleting there is an urgent need to replace them with a more synthetic and renewable energy source such as hydrogen.
Hydrogen has no greenhouse emissions, since it only produces water and heat energy during combustion; it is thus environmentally friendly. It has a high heat energy density (143MJ/kg) from combustion when compared with other fuels. For instance, hydrogen releases approximately three times more energy than same weight/weight ratio of petrol and diesel (Azbar and Levin, 2012). The energy can be converted to mechanical energy in combustion engines or used to generate electricity in proton exchange membrane fuel cells (Azbar and Levin, 2012). Currently, hydrogen is synthesised mainly from fossil fuels and energy-intensive processes such as gasification of coal, steam reformation-methane and electrolysis (Moremilan and Veziroglu, 2002). There is a considerable and growing interest in biological hydrogen production by exploiting the use of micro-organisms in light-dependent processes (e.g. photo-fermentation) or light-independent processes (i.e. dark fermentation), thus eliminating the utilisation of non-renewable resources (Kothari et al., 2012). However, dark fermentation has proved popular in recent years, due to the ability of anaerobic micro-organisms to produce hydrogen by utilising carbohydrates within a diverse range of organic waste feedstocks and wastewater from sewage treatment, food, agriculture and municipal industries (Martínez-Pérez et al., 2007). Moreover, dark fermentation is cheaper than light-dependent processes and the rates of hydrogen production are significantly greater (Levin et al., 2004; Kothari et al., 2012).
Fermentative hydrogen production occurs in anaerobic conditions (those where there is no oxygen or other terminal acceptors) and a process in which glucose is oxidised to carbon dioxide, H2 and volatile fatty acids (VFA). Acetate and butyrate are associated to hydrogen production with theoretical maximum yields of 4 moles H2/mol glucose and 2 moles H2/mol glucose, respectively (Hawkes et al., 2002). Biological hydrogen has reportedly been produced by various species of fermentative bacteria: Clostridium, Bacillus, Klebsiella, and Citrobacter (Show et al., 2012; Lee et al., 2011). Pure cultures, in particular Clostridium species, are found to be promising fermentative hydrogen producers among other genera (e.g. Enterobacter, Bacillus) with the highest hydrogen yields of 1.61-2.36 mol H2/mol hexose (Hawkes et al., 2002). Wu et al. (2006) also reported a highest hydrogen production rate of 15L/h/L from C. pasteurianum. Studies on fermentative biohydrogen production have primarily been based on using pure strains of bacteria, especially clostridia, with expensive pure carbon sources such as glucose (Wang and Jin, 2009).This aids in the determination of parameters and environmental conditions affecting the hydrogen rate or yield, but is not practically feasible.
Waste feedstocks are heterogeneous and complex in nature; therefore, even though pure cultures are known to give higher hydrogen yields, their lack of metabolic flexibility will prevent digestibility for hydrogen production. Moreover, waste feeds require sterilisation with pre-treatments (ultrasonication, heat treatment etc.) to solubilise carbohydrates and for the maintenance of sterile conditions, which adds to the fermentation costs (Guo et al., 2008). Artificially constructed co-cultures with well-defined hydrogen producers and a consortium of micro-organisms derived from natural sources (sewage sludge, soil, and compost) are of great interest due to their metabolic diversity and enzymatic reactions, which allow co-cultures to utilise a variety of complex sugars (polysaccharides, disaccharides etc.) compared to pure cultures (Bader et al., 2013). Microflora in waste is capable of tolerating changes to environmental conditions, limiting nutrients. In addition, syntrophic and synergic interactions can occur between organisms, leading to more efficient degradation and possibly higher hydrogen yields (Bader et al., 2013). For instance, metabolites that inhibit hydrogen production can also be utilised in exchange by different micro-organisms. Lactic acid and acetic acid are reportedly utilised by C. diolis JPCC H-3 to produce hydrogen (Matsumoto and Nishimur, 2007). In terms of biotechnology benefits, a consortium can potentially produce new secondary metabolites such as butanol and acetone, which could be of great value.
Many microbial consortia and mixed cultures from natural sources have been used in attempts to improve hydrogen production, although the hydrogen yield from them continues to be low: 1.0- 3.1 mol H2/ mol of glucose (Baghchehsaraee et al., 2010; Wang and Wan, 2009; Patel et al., 2010; Hiligsmann et al., 2011). In comparison, co-cultures could provide better synergistic interactions for H2 production. The 'creation' of stable artificial co-cultures of well-defined hydrogen producers has been problematic due to differences in growth rates, pH requirements, consumption and excessive production of metabolites between micro-organisms (Hawkes et al., 2002; Weibel, 2008). However, there have been reports of robust constructed co-cultures which have produced higher yields and overcome the drawbacks of undefined consortia. The co-existence of Caldicellulosiruptor saccharolyticus DSM 8903 and C. kristjanssonii DSM 12137 gives a yield of 3.7 mol of H2 /mol of glucose, which is higher than any mixed culture to date (Chang et al., 2008). In other studies, syntrophic associations between clostridia species and facultative aerobes Enterobacter and Bacillus have significantly enhanced hydrogen production by consuming oxygen and preventing inhibition of H2 producing enzymes of the clostridia strain (Chang et al., 2008; Chou et al., 2011). Bacillus thermoamylovorans and Enterobacter aerogenes are known to have multiple extracellularenzyme activities, which aids the pre-saccharification of recalcitrant organic solid waste and lignocellulosic biomass, and this enhances substrates available to co-cultured clostridia strains (Chang et al., 2008; Chou et al., 2011; Patel et al., 2014). Recently, Patel et al. (2014) demonstrated that co-cultures of B. cereus and E. cloacae can simultaneously degrade lignocellulosic materials with a 6.4 fold higher H2 yield compared to pure cultures and mixed cultures.
Aims and objectives
This study investigated the generation of hydrogen from a cheaper carbon source, molasses, using co-cultures of clostridia. Molasses contains a complex mixture of various sugars and carbohydrates; therefore it is thought that the addition of nitrogen sources, such as peptone and vitamins, is not required (Wang and Jin, 2009). Moreover, the sugar-refining industry produces high volumes of molasses from sugar cane and sugar beet; therefore this report aims to show that sugary wastewater can be utilised for hydrogen production from food industries using artificial co-cultures (Wang and Jin, 2009). Clostridium beijerinckii is capable of utilising many different carbohydrates such as fructose, cellubiose, xylose etc. The objective was to characterise and determine whether co-cultures of Clostridium bejierinckii (NCIMB 6444) and Clostridium butyricum (NCIMB 9578) produce more hydrogen compared to pure strain cultures and to assess whether molasses provides stable hydrogen production in four days of fermentation. Factors such as changes in pH, medium composition and metabolic shifts due to bacterial interactions were analysed by detecting metabolites on GC. The hypothesis was that the co-culture of C. butyricum and C. beijerinckii would produce higher volumes of hydrogen compared to pure cultures because of their metabolic diversity and synergistic associations, which aid the utilisation of complex sugars in molasses.
Materials and methods
Bacterial strains and maintenance
Clostridium bejierinckii (NCIMB 6444) and Clostridium butyricum (NCIMB 9578) were purchased from the National Collection of Industrial Marine Bacteria (NCIMB, UK). The strains were revived and sub-cultured in 60ml of PYG nutrient medium, containing tryptone-2g/L, yeast extract-0.2g/L and glucose-0.2g/L in serum glass bottles. Following inoculation, nitrogen gas was sparged for 10 minutes to create an anaerobic environment before incubating at 37˚C at 150rpm for 12 hours. Glycerol stocks of C. butyricum and C. beijerinckii were prepared and subsequently stored at -25˚C in a freezer; sub-cultured serum vials were maintained at 3˚C.
Resources
All the materials and regents were purchased from Sigma Aldrich.
Medium composition and preparation for fermentative hydrogen production
In this study molasses was used as the carbon source. Lyles Black treacle molasses was purchased from Abram Lyle & Sons sugar refiners, containing 64g of total sugars and 1.7g of proteins. Formulated MDT medium ingredients (5g casein peptone, 0.5g yeast extract, 1.2g KH2PO4, 5.1g Na2HPO4, 0.5 g MgSO4, 0.5g MgSO4x 7H2O and 0.5g L-cysteine), as described by Masset et al. (2012), were added to 10g/L of molasses. The molasses was combined with other ingredients in MDT medium to ensure that all the necessary nutrients were supplemented for optimal bacterial growth with initial medium pH of 7.3-7.5. MDT with molasses medium was autoclaved at 110˚C for 10 minutes to prevent degradation of sugars.
Experimental procedures: batch pure culture and co-culture conditions
Batch fermentative hydrogen production from pure and co-cultures of Clostridium spp was initially carried out in 150ml serum glass bottles. The final culture working volume in the serum glass bottles was 100ml, in which 10% v/v of inoculum was seeded. Each serum bottle was supplemented with 90ml of MDT medium. Pure cultures of C. butyricum and C. beijerinckii contained 10ml of inoculum, whereas the control culture test had no inoculum and only MDT medium. The co-culture was prepared by adding 5ml of C. butyricum and 5ml of C. beijerinckii inoculum. Six repeats (n=6) were carried out for each culture in which the control only contained the medium.
Followed by inoculation, the serum bottles were sealed with rubber stoppers and aluminium caps. Nitrogen gas was sparged into the head space and medium for 5-10 minutes to remove oxygen from the system and create anaerobic conditions for optimal growth of Clostridium spp. The cultures in serum bottles were incubated at 30˚C and agitated in a rotatory shaker at 170rpm. The fermentation was carried out for four days in which hydrogen gas production, biomass concentration, pH and glucose consumption were monitored daily.
Hydrogen gas measurements
The total accumulative hydrogen gas in the head space was measured daily (every 24 hours) using an appropriately sized syringe (5ml-12ml) via plunger displacement method (Owen et al., 1979). Hydrogen was collected until a vacuum was created in the vials.
Sampling and assays: serum vial batch culture and scale-up
Liquid samples were drawn from the cultures, using a syringe, at pre-determined time intervals (every 24 hours) for four days.
The optical density of the cultures was measured at 600nm using spectrophotometer JENWAY model 6305. The pH changes over the experimental period were determined using a calibrated pH meter (Oakton benchtop series 700).
The phenol sulphuric acid method, as described by Dubois et al.(1956), was used to determine the glucose concentration and sugars remaining in the culture on a daily basis. Due to the complexity and diversity of carbohydrates present in molasses, the concentration of glucose in molasses was measured in relation to sugar consumption. A standard curve with known concentrations of glucose (0-100mg/L) was used to determine the amount of glucose remaining in the pure and co-culture medium. Residual liquid in samples from centrifugation at 13,000x g for 5 minutes was used in this assay.
The viability of cells in pure and co-cultures was determined from final samples using the LONZA trypan blue viability test. Samples were diluted tenfold and stained using 0.4% trypan blue (Sigma Aldrich). Dead cells were counted using haemocytometer at x40 magnification under light microscope (Zeiss primo star).
Analytical methods
Detection of H2 gas composition
The hydrogen composition in 1ml of biogas injected from the head space was analysed and measured using gas chromatography (SRI, model 310C) with a thermal conductive detector -TCD. Nitrogen was used as the carrier gas which was flowing through 0.53mm capillary column. A one point calibration was performed using 50% hydrogen /50% nitrogen to determine the peak area which corresponded to 50% H2 within 1ml of injected calibration gas. Accordingly, the peak area represented the percentage composition of hydrogen gas within gaseous samples analysed.
Detection of metabolites produced using gas chromatography
Metabolites and VFA produced during fermentation were analysed using gas chromatography (Varian CP-3800). Final liquid samples were centrifuged at 13,000g (Thermo Scientific-Heraeus Pico) and filtered using a 0.2µm filter to remove collides and cells. Supernatant was stored in 1ml GC vials. The GC contained TCD with a column size of 30mm length x 0.320mm diameter x 0.50µm film - HP INNOWax (Agilent J&W GC columns).The mobile phase was hydrogen and helium gas with a flow rate of 2ml/ml. The programme innowax was used, with the following temperature conditions: injector temperature of 220˚C, detector temperature of 250˚C. The chamber temperature was maintained at 35˚C from 0-5 minutes after which it increased constantly to 170˚C for 15 minutes. Unknown concentrations of metabolites were determined using analysed standard solutions of acetic acid, butyric acid and ethanol.
Statistical analysis
A one-way ANOVA test was used to determine the significant difference in total hydrogen gas (n=6) produced between pure and co-cultures at p-value of 0.05. An independent T-test was used to determine the differences in total hydrogen gas between individual pure strains. All the statistics were calculated using SPSS software. 95% confidence limits and standard error have been plotted on graphs.
Scale-up of hydrogen production from co-culture
The co-culture was scaled up to a 5-litre fermenter operated at 37˚C and 170rpm. The working volume was 4 litres with 10g/L of molasses concentration + MDT which was inoculated with 10% v/v of C. butyricum and C. beijerinckii inoculum. All the parameters were measured as before: cell concentration, metabolites produced, pH, viability. The pH and percentage of hydrogen was measured using data logger National Instruments Lab VIEW programme.
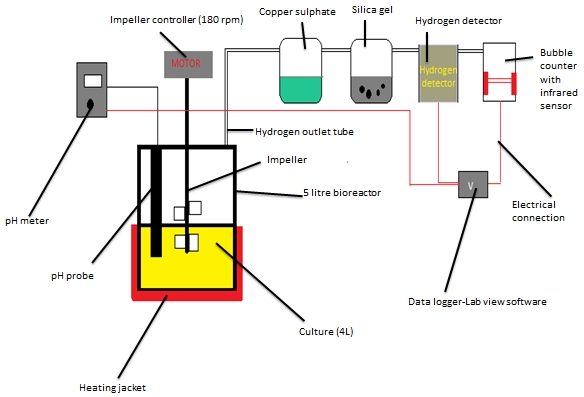
Figure 1: Schematic diagram of hydrogen production from batch fermentation using co-culture operated for 56 hours with an online pH, % hydrogen and bubble counter data logger.
Results
Comparative hydrogen production by pure and co-cultures
The data (Table 1) suggests that there is significant variation in the volume of hydrogen produced in four days of fermentation between pure and co-cultures. It was evident that on day 1 (after 24 hours) the highest volume of hydrogen gas was produced by pure cultures and co-cultures; nonetheless the amount of H2 produced decreased rapidly in the following days. The co-culture produced the highest volume of H2 of 46.7ml on day 1 compared to C. butyricum (25.9ml) and C. beijerinckii (42.5ml). Figure 2 suggests that there is no significant difference in total cumulative H2 gas production between C. beijerinckii (63.8ml) and the co-culture (62.8ml) at a 95% probability level. The total cumulative H2 gas is higher for C. beijerinckii (63.8ml) and co-culture (62.8ml) compared to C. butyricum (51.2ml). Furthermore, one-way ANOVA proved that there is no significant difference in the total hydrogen gas produced between pure and co-cultures with a p-value of 0.573 (F=0.753).
| Volume of hydrogen produced daily (ml) / standard deviation ± (n=6) | ||||
|---|---|---|---|---|
| Day | Control (No micro-organism) |
C.butyricum (NCIMB 9578) |
C. beijerinckii (NCIMB 6444) |
Co-culture (C.butyricum + C. beijerinckii) |
| 0 | 0 | 0 | 0 | 0 |
| 1 | 0 | 25.9 ± 5.9 | 42.5 ml± 6.7 | 46.7 ± 6.45 |
| 2 | 0 | 15.9 ± 8.4 | 14.5ml ±8.5 | 9.5 ±4.34 |
| 3 | 0 | 5.7 ±3.6 | 5.1 ml±6.23 | 4.2 ±2.17 |
| 4 | 0 | 3.8 ± 3.8 | 1.7ml ±2.04 | 2.3 ±2.78 |
| Total | 0 | 51.3ml | 63.6ml | 62.7ml |
Table 1: Mean (n=6) volume hydrogen gas produced daily in four days of fermentation by pure and co-cultures of Clostridium spp.
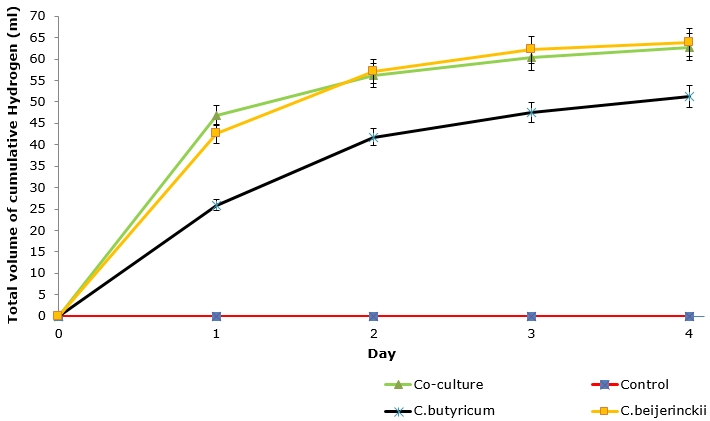
Figure 2: Total cumulative hydrogen gas produced daily by pure and co-culture in four days. Error bars show 95% confidence limits from the mean (n=6) volume of hydrogen produced.
Culture growth and glucose consumption
The cell density was higher for co-cultures compared to pure cultures. Growth of C. beijerinckii and co-culture remained stable during the four days of fermentation; this implies that cultures had reached the stationary phase within 24 hours of fermentation (Figure 3). A steady increase in OD was observed for C. butyricum, indicating a slow growth during the four days of fermentation, but the cell density was low compared to other cultures (Figure 3). Overall, the control contained 5115mg/L of glucose in molasses. It is observable from Table 2 that the highest consumption of glucose from molasses was found after 24 hours in all the cultures. However, the utilisation rate of glucose rapidly decreased, leading to poor growth. Maximum consumption of glucose (3755 mg/L) was found for C. beijerinckii (Table 2).
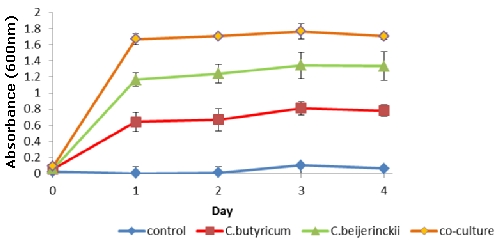
Figure 3: Growth of pure culture and co-culture during hydrogen production when supplemented with 10g/L of molasses. Errors of mean (n=6). Optical density is shown for each culture.
| Pure/co-culture | Day 1 | Day 2 | Day 3 | Day 4 | Total; g glucose equivalent to/g of molasses consumed |
|---|---|---|---|---|---|
| Control | 0 | 0 | 0 | 0 | 0 |
| C.butyricum | 3500 | 3805 | 3947 | 3944 | 470 |
| C. beijerinckii | 3755 | 3844 | 3863 | 3918 | 501 |
| Co-culture | 3544 | 3783 | 4022 | 3970 | 490 |
Table 2: Total amount of glucose consumed daily (mg/l) from 10g/L of molasses. The equivalent gram glucose to gram of molasses consumed is also calculated.
pH, viability and metabolites produced during fermentation
The initial pH of medium was 7.59 (control) which declined rapidly to 5.59-4.99 in pure and co-culture (Table 3) due to VFA production (Figure 5), i.e. acetic and butyric acid during hydrogen production. Co-culture and C. butyricum have a more acidic pH compared to C. beijerinckii (Table 3). The buffering action of the MDT medium prevented any large drop in pH, hence a constant pH range was observed in the four days of fermentation in all the cultures. pH and VFA showed an inhibitory effect on the cultures and hydrogen gas production, which was assessed by measuring dead cell counts (Table 3). It can be observed from Table 3 that the most number of dead cells was found for co-culture (3.7 x10⁸ cells/ ml) compared to pure cultures. Butyric acid and acetic acid were the major metabolites produced in the cultures (Figure 4). Moreover, butyric acid was detected at a higher concentration (approximately double) than acetic acid; this suggests that hydrogen was directly produced through the butyric acid metabolic pathway. C. beijerinckii (4.63g/L) and co-cultures (4.87 g/L) produced a greater amount of butyric acid compared to C. butyricum (3.5g/L), which explains why higher total cumulative gas was measured for the two cultures.
| Average daily pH (n=3) | Final | ||||
|---|---|---|---|---|---|
| Pure/Co-culture | 1 | 2 | 3 | 4 | Dead Cell count x108 (Cells/ml) |
| Control | 7.59 | 7.35 | 7.25 | 7.34 | 0 ± 0 |
| C.butyricum | 5.14 | 5.13 | 5.31 | 5.32 | 3.1± 1.77 |
| C. beijerinckii | 5.79 | 6.03 | 6.13 | 6.23 | 2.5± 0.61 |
| Co-culture | 4.99 | 5.13 | 5.15 | 5.17 | 3.7± 1.00 |
Table 3: pH during hydrogen production was determined on daily basis for each culture. Viability of pure and co-cultures was measured by determining dead cells at the end of fermentation.
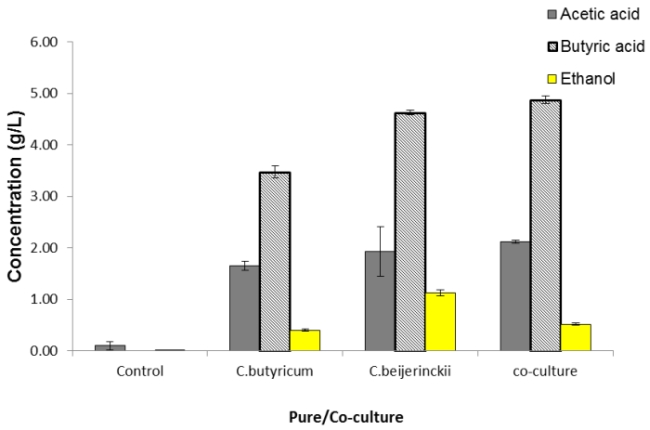
Figure 4: Metabolites produced during fermentation were determined using GC. The graph shows concentration of acetic acid, butyric acid and ethanol in pure and co-cultures.
Scale-up of hydrogen production by co-culture of C. butyricum and C. beijerinckii
There was no significant difference in hydrogen production between pure cultures (especially C. beijerinckii) and co-cultures. The co-culture was scaled up to a 5L batch fermenter to increase hydrogen gas production rate per litre and the total volume of gas produced. The pH was uncontrolled.
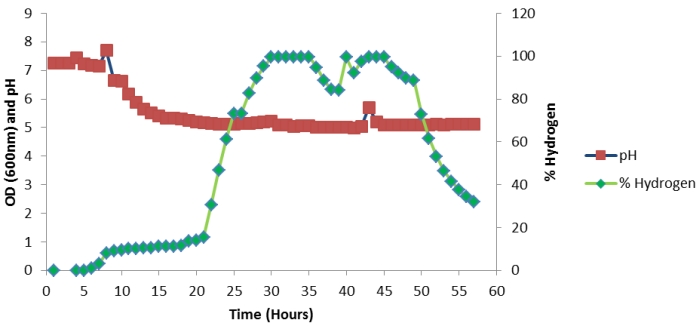
Figure 5: Continuous profile of % hydrogen and pH in 57 hours of batch fermentation (5 litres).
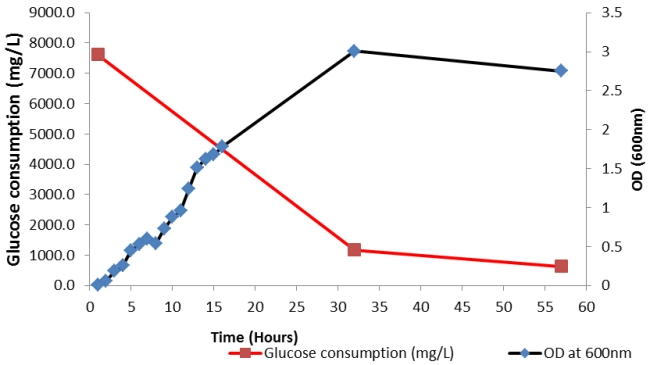
Figure 6: OD and glucose consumption of co-culture 5-litre batch fermentation for 57 hours.
The results in Figures 5 and 6 show that as the biomass concentration increases, the hydrogen production increases correspondingly. During the exponential phase (Figure 6) between 25-30 hours the hydrogen composition rapidly increased from 20% to 97% (Figure 5). Moreover, the highest gas composition of 99% hydrogen was measured between 30 hours to 45 hours at maximum biomass concentration (Figure 5). As the culture grows it produces hydrogen and the accumulation of metabolites such as VFA at the exponential phase, causing a rapid decrease in pH from 7 to 5. Figure 5 demonstrates that the drop in pH irreversibly elevated hydrogen production, where a pH of 5.0-5.5 was found to be the optimum for hydrogen production. A decline in biomass after 30 hours was observed (Table 5) due to the inhibitory effect of acidic pH. The exhaustion of glucose with limiting nutrient environment and the added toxic effects of acids causes a reduction in % hydrogen production between 50-60 hours.
Scale-up: hydrogen yield and rate, viability and metabolites produced during the fermentation
GC analysis of metabolites for the scale-up study showed a higher concentration of acetic acid in the culture compared to butyric acid (Table 4). The level of acetic acid produced between 24-48 hours directly corresponds to the elevated hydrogen production rate (23.48 ml /l /h) and hydrogen yield 1.32 (mol H2/mol glucose). One of the issues which needs to be considered is that metabolites produced and the yield are not equivalent to each other, due to the excessive sugars present in molasses. A possible explanation for the rise in ethanol concentration is that the metabolic pathway alteration from acid production to ethanol production was due to escalation of hydrogen production. The dead cell count indicates the inhibition cell culture due to low pH and toxic metabolites (mainly acids).
| Time (hours) | Ethanol (g/L) | Acetic acid (g/L) | Butyric acid (g/L) | Hydrogen production rate (ml/l/h) | Final dead cell count (cells /ml) | H2 yield (mol H2/mol glucose) |
|---|---|---|---|---|---|---|
| Within 24hr | 3.54 | 7.20 | 0.37 | 12.82 | ||
| 24-48 hours | 2.04 | 8.60 | 3 | 23.48 | 2.35x10⁸ | 1.35 |
Table 4: Concentration of end products of fermentation, i.e. metabolites produced during batch fermentation at time 24 hours and 56 hours. Final dead cell count, hydrogen production rate and hydrogen yields are also shown below.
Discussion
The study demonstrated that it is possible to generate hydrogen from a cheaper substrate molasses using C. beijerinckii and C. butyricum. Molasses and starch have been reported to give higher hydrogen yields (approximately double) and rates compared to glucose (Wang et al., 2008; Wang and Jin, 2009). Recently, Wu et al. (2013) optimised the performance of continuous hydrogen production from co-fermenting liquid swine manure with molasses by defining optimal pH and hydraulic retention time (HRT). The use of pure cultures for hydrogen production from complex medium or waste feedstocks has been problematic due to the requirements of sterile conditions and incomplete utilisation of substrates. However, recently artificial co-cultures of known Clostridium spp demonstrated a higher H2 production rate of 1.5 L biogas/h compared to pure cultures without the need for pre-treatments to hydrolyse starch compounds (Masset et al., 2012). Additionally, oxygen sensitivity is a major limiting factor of Clostridium spp and other anaerobes due to the fact that expensive reducing agents like L-cysteine or nitrogen gas needs to be added, which is not economically feasible at larger scale. Enterobacter aerogenes as a scavenging agent of oxygen with C. butyricum in a co-culture was proven to produce higher hydrogen yield compared to pure cultures (Yokoi et al., 1998).
The results in this investigation demonstrated no significant difference in the total hydrogen gas production between pure and co-cultures (ANOVA p >0.05); this suggests that co-existence of both the strains did not enhance hydrogen production as expected. Principally, C. beijerinckii produces a toxin called bacteriocin or circularin A when in contact with other Clostridium spp (Masset et al., 2012). This assumption can be supported by the evidence as to why C. beijerinckii and co-cultures have relatively similar total H2 gas values (Table 1), i.e. a possible inhibition of C. butyricum in the co-culture. Another important factor which needs to be considered is that the cell density of co-culture is highest in four days of fermentation; this demonstrates that the two strains could be stable in the co-culture. There is significant variation in the levels of hydrogen gas production between pure and co-culture each day. C. beijerinckii and co-culture have similar hydrogen production trends (Figure 2); however, the level of biomass produced and H2 gas production observed on each day is highly different. C. beijerinckii produced higher H2 gas due to its ability to metabolise diverse range of sugars such as mono-saccharides, disaccharides (fructose maltose, xylose etc.) from molasses compared to C. butyricum (Chang et al., 2008).
The T-test with P<0.05 (n=6) and Figure 2 further prove that pure cultures have differences in the total volume of hydrogen gas production at a 95% probability level. Pure cultures in this study confirm that individual physiologies between different species of clostridia have a substantial impact on H2 gas production. All the cultures produced the maximum H2 gas in 24 hours and the highest volume was measured for co-cultures. A rapid decline in H2 gas in the following three days was due to the prevailing nutrient and glucose limiting environment along with inhibitory effects of low pH and VFA (acetic and butyric acids).
Effect of pH
pH is considered a central parameter which affects hydrogen production by alternating the metabolic pathways through inhibiting the enzymatic activity of Clostridium species (Khanal et al., 2004). An acidic pH range of 4.0-7.0 promotes the production of acetic acid and butyric acid, both of which are associated with increased hydrogen yields (Hawkes et al., 2002; Khanal et al., 2004). In this study, the pH of the medium was unregulated and initially was 7.38± 0.34. The elevated VFA production, i.e. butyric and acetic acid, consequently decreased the pH to 4.99-5.85 within 24 hours of fermentation in all the cultures. Clostridium species produce H2 gas during the exponential phase but the extensive gas production leads to larger amounts of acids being produced which in turn cause a change in metabolic shift from H2 to solvent production. The increased hydrogen production during the exponential phase leads to more rapid accumulation of acids and their dissociation lowers the buffering capacity of MDT medium; thus, a constant pH range in all the cultures is observed in the four days of batch fermentation.
The scale-up study demonstrated that the drop in pH from 6 to 5 triggered higher hydrogen production due to acidogenesis. Masset et al. (2012) reported that individual species of Clostridium have an optimal pH for maximum hydrogen production rate. For example, C. butyricum has optimal pH of 5.15 and 4.7 is inhibitory, whereas C. beijerinckii has 6.7 as optimal and 5.2 is inhibitory. The difference in pH requirements suggests a possibility of bacterial population shift, i.e. dominant growth of C. butyricum in co-culture, since the pH range was 4.99-5.17, thus inhibiting growth of C. beijerinckii. Wu et al. (2012) also demonstrated that maintaining optimal pH (5.32) is critical for biogas production rate and any decrease in pH will greatly reduce productivity. In this study, the pH of the co-culture (4.99) reduced H2 production fivefold due to the toxic effects of acids.
From Table 1, it is observable that the highest hydrogen gas is produced on day 1 (after 24 hours) with a pH of 4.99; this may suggest that the extent of hydrogen produced will lead to higher concentration of acetic and butyric acid production hence a low pH is observed. Dead cell count was used to assess viability of the culture. A high number of dead cells (Table 3) was recorded in all the cultures due to the inhibitory effect of undissociated VFA, especially butyric and acetic acid, which can be transported into the cells, perturbing the pH gradient across the membrane and leading to cell death (Hawkes et al., 2007). It has to be emphasised that all the cultures had an inhibitory impact of acidic pH with the highest dead cell count measured in the co-culture (3.7x10⁸cell/ml). Measuring dead cells using trypan blue and not Colony Forming Units (CFU) was a limitation in this experiment. The reason why the co-culture produced a higher hydrogen yield compared to C. butyricum is likely to be due to the presence of both the strains as initial major workforce; however, the microbial community will change with the time of fermentation and with the decrease of pH. The overall total hydrogen volume of the co-culture and C. beijerinckii are similar. Two cultures can follow similar profiles; however, the individual volumes measured for each day are significantly different. Both the negative interaction and inhibition by low pH has to be accounted for in this study.
The main reason for choosing two distinct species of clostridia was because C. beijerinckii is capable of utilising wide range of sugars and C. butyricum is a potent hydrogen producer. Growth has been demonstrated to be better at pH 6.0-6.5 and was inhibited at pH 5.0 whereas optimal H2 production was found at 5.5 (Hawkes et al., 2002; Chen et al., 2005). For this reason no significant increase in optical density (Figure 3) was observed for pure and co-cultures within four days of fermentation due to reduced ATP levels and activity; thus growth remained stationary. Figure 3 demonstrates higher cell density for C. beijerinckii, indicating a higher growth rate compared to C. butyricum.
Metabolites produced
Changes in metabolic pathway occur due to environmental changes such as pH, partial pressure of hydrogen, and cell growth, all of which have a profound effect on hydrogenase enzyme [Fe-Fe] (Khanal et al., 2004). During hydrogen production various metabolites are produced, such as acetate, butyrate and formate. A higher ratio of acetate to butyrate is linked to higher hydrogen yields (Hu et al., 2013). In contrast, solvent production or reduced compounds (ethanol, acetone, lactate) are associated with lower hydrogen yields due to a lack of re-oxidation and consumption of NADH (Hawkes et al., 2002). An acidic pH range in all cultures suggests extensive production of VFA rather than solvent production. In this study, butyric acid was produced at higher concentrations compared to acetic acid, signifying that the ratio of acetate to butyrate was lower(approximately 2.29-2.10 fold), hence only 2 moles of H2 per hexose was produced. Butyric acid was the major soluble metabolite produced in all the treatments with similar findings by Lay et al. (2010). Variations in acetic and butyric acid concentrations were due to changes in environmental conditions which altered the metabolic pathways. In addition, GC analysis of metabolites showed that hydrogen was produced mainly via the Pyruvate Ferredoxin Oxireductase (PFOR) pathway and it is the central pathway for H2 synthesis with a similar report found in Masset et al. (2012).The high level of butyric acid detected in the C. beijerinckii culture and co-culture corresponds to their elevated hydrogen yields compared to C. butyricum. C. beijerinckii is able to re-consume formate and lactate, producing additional hydrogen with carbon dioxide and butyrate as major by-products (Masset et al., 2012).This phenomenon is supported by the evidence of increased H2 gas production and a similar volume of H2 gas as the co-culture. Recently, Zhang et al. (2013) reported that inhibitory VFC can be reduced using a co-culture of C. beijerinckii and Geobacter metallireducens, but, more importantly, that it can increase hydrogen production by 52.3%. G. metallireducens was found to consume acetate from hydrogen production process for its growth without negatively competing for the carbon source with C. beijerinckii. Furthermore, Zhang et al. (2013) showed that co-culture of C. beijerinckii and G. metallireducens can improve xylose utilisation from lignocellulosic hydrolysate as well as reducing acetate using alternative extracellular electron shuttles. Geobacter metallireducens can utilise acetate, thus preventing low pH and the build-up of inhibitory metabolites, which leads to enhanced hydrogen production by C. beijerinckii.
Scale-up
Large-scale batch fermentation is reported to reduce the hydrogen yields due to inhibition of H2formation by excessive substrate and product formation (Argun and Kargi, 2011).
Lay et al. (2010) showed that commercial condensed molasses fermentation can greatly enhance hydrogen production on a large scale without the need of additional nutrients. The highest hydrogen (390 mmol H2/L-d) produced was at an organic loading rate of 320 g COD/L-d at a HRT of 3 h (Lay et al., 2010). For example, hydrogen partial pressure and metabolic alternations are key factors affecting hydrogen production on larger scale (Hawkes et al., 2002). In this study, an increase in hydrogen production rate from 12.82ml/l/h to 23.48 ml/l/h was found after 24 hours, suggesting a slow release of glucose from the degradation of molasses which elevated the H2 production at the latter stage of the fermentation. The scale-up study did increase the throughput of hydrogen which rapidly declined due to the impact of low pH and VFA. Variations in metabolites concentrations were detected; higher acetate to butyrate ratio was detected compared with serum bottle cultures and this correlates with higher H2 yield. 65% of metabolite was acetate, thus hydrogen was produced with theoretical maximum value of 4 mol H2/mol glucose. Hawkes et al. (2002) demonstrated that the build of partial pressure of hydrogen leads to metabolic alternation to ethanol production. The profile of volatile metabolites shows that a higher ethanol concentration (eight times higher) was detected in the scale-up study in contrast to the serum bottles, due to build of hydrogen gas. Excess metabolites were produced because molasses contains complex mixtures of different sugars, all of which can be further metabolised. Longer chain-length sugars produce more hydrogen and different carbohydrate is known to give different metabolite concentrations of ethanol, acetic and butyric acids (Quéméneur et al., 2011).
Progressive works from this study will focus on testing the co-culture under continuous operating condition and determining the optimal running parameters for the system. The proliferation ratio of C. butyricum and C. beijerinckii in the co-culture will also be examined with competition assays to determine negative interactions.
Conclusion
This study demonstrates that molasses as a modelled sugary waste from the industry can be used for hydrogen production as a cheaper carbon source. Results from this investigation did not show any marked difference in hydrogen production between co-cultures and pure cultures of C. butyricum and C. beijerinckii (one-way ANOVA- F=0.753). C. beijerinckii and co-culture was found to produce 63.6 ml and 62.7ml respectively, whereas C. butyricum produced the lowest hydrogen of 51.3ml in four days of fermentation. Co-cultures did produce the highest volume of hydrogen after 24 hours (51.3 ml); however, low pH (4.99-5.17) and VFA (acetic acid 2.2 g/L and butyric 4.87g/L) inhibited hydrogen production. The highest dead cell count of 3.7x10⁸ cells/ml was observed for the co-culture, suggesting an inhibitory effect of pH and a possible negative interaction. This shows that if sugary wastewater is to be used as feedstock, pH needs to be controlled by the removal of inhibitory metabolites (acetic acid and butyric acid) for stable hydrogen production, as well as positive synergistic interactions between individual strains. Pure cultures did show differences in hydrogen gas production and growth rates due to individual physiology and metabolic pathways. A low pH 6.23 – 4.99 and VFA inhibited hydrogen production and growth of all the cultures. C. beijerinckii has more potential for application in artificially constructed co-cultures using waste feedstocks due to its ability to hydrolyse various carbohydrates, especially cellulose and xylose.
Acknowledgements
I would like to acknowledge the University of Westminster FST Undergraduate Bursary Scheme which supported this work. I would like to express my gratitude to Dr Godfrey Kyazze for his support, expert advice and guidance received during this investigation. In addition, I would also like to thank Dr Adelaja Oluwaseun for his valuable advice and support in analytical techniques. Special thanks to my friend Dr Hafiz Iqbal for his guidance and support during this publication.
List of figures
Figure 1: Schematic diagram of hydrogen production from batch fermentation using co-culture operated for 56 hours with an online pH, % hydrogen and bubble counter data logger.
Figure 2: Total cumulative hydrogen gas produced daily by pure and co-culture in four days. Error bars show 95% confidence limits from the mean (n=6) volume of hydrogen produced.
Figure 3: Growth of pure culture and co-culture during hydrogen production when supplied with 10g/L of molasses. Errors of mean (n=6) Optical density is shown for each culture.
Figure 4: Metabolites produced during fermentation were determined using GC. The graph below shows concentration of acetic acid, butyric acid and ethanol in pure and co-cultures.
Figure 5: Continuous profile of % hydrogen and pH in 57 hours of batch fermentation (5 litres).
Figure 6: OD and glucose consumption of co-culture 5-Lltre batch fermentation for 57 hours.
List of tables
Table 1: Mean (n=6) volume hydrogen gas produced daily in 4 days of fermentation by pure and co-cultures of Clostridium spp.
Table 2: Total amount of glucose consumed daily from 10g/L of molasses. The equivalent g glucose to gram of molasses consumed is also calculated.
Table 3: pH during hydrogen production was determined on daily basis for each culture.
Table 4: Concentration of end -products of fermentation i.e. metabolites produced during batch fermentation at time 24 hours and 56 hours. Final dead cell count, hydrogen production rate and hydrogen yields are also shown.
Notes
[1] Mohit Santilal graduated from the University of Westminster with a first class BSc (Hons) Biotechnology degree. He is currently studying MSc Biochemical Engineering at University College London (UCL).
References
Argun, H. and F. Kargi (2011), 'Bio-hydrogen production by different operational modes of dark and photo-fermentation: an overview', International Journal of Hydrogen Energy, 36 (13), 7443–59
Azbar, N. and D. B. Levin (2012), State of the Art and Progress in Production of Biohydrogen, Bentham Science Publishers
Bader, J., E. Mast-Gerlach, M. Popović, R. Bajpai and U. Stahl (2010), 'Relevance of microbial co-culture fermentations in biotechnology', Journal of Applied Microbiology, 109 (2), 371–87
Baghchehsaraee, B., G. Nakhla, D. Karamanev and A. Margaritis (2010), 'Fermentative hydrogen production by diverse microflora', International journal of hydrogen energy, 35(10), 5021–27
Chang, J., C. Chou, C. Ho, W. Chen, J. Lay and C. Huang (2008), 'Syntrophic co-culture of aerobic Bacillus and anaerobic Clostridium for bio-fuels and bio-hydrogen production', International Journal of Hydrogen Energy, 33 (19), 5137–46
Chen, W., Z. Tseng, K. Lee and J. Chang (2005), 'Fermentative hydrogen production with Clostridium butyricum CGS5 isolated from anaerobic sewage sludge', International Journal of Hydrogen Energy, 30 (10), 1063–70
Chou, C. H., C. L. Han, J. J. Chang and J. J. Lay (2011), 'Co-culture of Clostridium beijerinckii L9, Clostridium butyricum M1 and Bacillus thermoamylovorans B5 for converting yeast waste into hydrogen', International journal of hydrogen energy, 36(21), 13972–83
Dubois, M., K. A. Gilles, J. K. Hamilton, P. T. Rebers and F. Smith (1956), 'Colorimetric method for determination of sugars and related substances', Analytical Chemistry, 28 (3), 350–56
EIA (2013), 'International energy outlook 2013', U.S Energy information administration, Available at http://www.eia.gov/forecasts/ieo/index.cfm, accessed 13 December 2014
European Commissions (2014), 'EU greenhouse gas emissions and targets', EU, available at http://ec.europa.eu/clima/policies/g-gas/index_en.htm, accessed 13 December 2014
Guo, L., X. Li, X. Bo, Q. Yang, G. Zeng, D. Liao and J. Liu (2008), 'Impacts of sterilization, microwave and ultra-sonication pre-treatment on hydrogen producing using waste sludge', Bioresource Technology, 99 (9), 3651–5 8
Hawkes, F. R., I. Hussy, G. Kyazze, R. Dinsdale and D. L. Hawkes (2007), 'Continuous dark fermentative hydrogen production by mesophilic microflora: principles and progress', International Journal of Hydrogen Energy, 32(2), 172– 84
Hawkes, F. R., R. Dinsdale, D. L. Hawkes and I. Hussy (2002), 'Sustainable fermentative hydrogen production: challenges for process optimisation', International Journal of Hydrogen Energy, 27 (11–12), 1339–47
Hiligsmann, S., J. Masset, C. Hamilton, L. Beckers and P. Thonart (2011), 'Comparative study of biological hydrogen production by pure strains and consortia of facultative and strict anaerobic bacteria', Bioresource technology,102 (4), 3810–18
Hu, C. C., A. Giannis, C. L. Chen, W. Qi and J. Y. Wang (2013), 'Comparative study of biohydrogen production by four dark fermentative bacteria', International Journal of Hydrogen Energy, 38 (35), 15686–92
Khanal, S. K., W. Chen, L. Li and S. Sung (2004), 'Biological hydrogen production: effects of pH and intermediate products', International Journal of Hydrogen Energy, 29 (11), 1123–31
Kothari, R., D. P. Singh, V. V. Tyagi and S. K. Tyagi (2012), 'Fermentative hydrogen production – An alternative clean energy source', Renewable and Sustainable Energy Reviews, 16 (4), 2337–46
Lay, C. H., J. H. Wu, C. L. Hsiao, J. J. Chang, C. C. Chen and C. Y. Lin (2010), 'Biohydrogen production from soluble condensed molasses fermentation using anaerobic fermentation', International Journal of Hydrogen Energy, 35(24), 13445–51
Lee, D., K. Show and A. Su (2011), 'Dark fermentation on biohydrogen production: Pure culture', Bioresource Technology, 102 (18), 8393–402
Levin, D. B., L. Pitt and M. Love (2004), 'Biohydrogen production: prospects and limitations to practical application', International Journal of Hydrogen Energy, 29 (2),173–85
Martínez-Pérez, N., S. J. Cherryman, G. C. Premier, R. M. Dinsdale, D. L. Hawkes, F. R. Hawkes, G. Kyazze and A. J. Guwy (2007), 'The potential for hydrogen-enriched biogas production from crops: Scenarios in the UK', Biomass and Bioenergy, 31 (2), 95–104
Masset, J., M. Calusinska, C. Hamilton, S. Hiligsmann, B. Joris, A. Wilmotte and P. Thonart (2012), 'Fermentative hydrogen production from glucose and starch using pure strains and artificial co-cultures of Clostridium spp', Biotechnology for Biofuels, 5 (1), 35
Matsumoto, M. and Y. Nishimura (2007), 'Hydrogen production by fermentation using acetic acid and lactic acid', Journal of Bioscience and Bioengineering, 103 (3), 236–41
Momirlan, M. and T. N. Veziroglu (2002), 'Current status of hydrogen energy', Renewable and Sustainable Energy Reviews, 6 (1–2), 141–79
Netherlands Environmental Assessment Agency (2013), 'Trends in Global Co2 emissions2013 report', PBL publishers, Available at http://edgar.jrc.ec.europa.eu/news_docs/pbl-2013-trends-in-global-co2-emissions-2013-report-1148.pdf, accessed 13 December 2014
Owen, W. F., D. C. Stuckey, J. B. Healy, L. Y. Young and P. L. McCarty (1979), 'Bioassay for monitoring biochemical methane potential and anaerobic toxicity', Water research, 13 (6), 485–92
Patel, S. K., P. Kumar, S. Mehariya, H. J. Purohit, J. Lee and V. C. Kalia (2014), 'Enhancement in hydrogen production by co-cultures of Bacillus and Enterobacter', International Journal of Hydrogen Energy, 39 (27), 14663–68
Patel, S. K., H. J. Purohit and V. C. Kalia (2010), 'Dark fermentative hydrogen production by defined mixed microbial cultures immobilized on ligno-cellulosic waste materials', International Journal of Hydrogen Energy, 35 (19), 10674–81
Quéméneur, M., J. Hamelin, S. Benomar, M. Guidici-Orticoni, E. Latrille, J. Steyer and E. Trably (2011), 'Changes in hydrogenase genetic diversity and proteomic patterns in mixed-culture dark fermentation of mono-, di- and tri-saccharides', International Journal of Hydrogen Energy, 36 (18), 11654–65
Show, K., D. Lee, J. Tay, C. Lin and J. Chang (2012), 'Biohydrogen production: current perspectives and the way forward', International Journal of Hydrogen Energy, 37 (20), 15616–31
Wang, J. and W. Wan (2009), 'Factors influencing fermentative hydrogen production: A review', International Journal of Hydrogen Energy, 34 (2), 799–811
Wang, X. and B. Jin (2009), 'Process optimization of biological hydrogen production from molasses by a newly isolated Clostridium butyricum W5', Journal of Bioscience and Bioengineering, 107 (2), 138–44
Wang, X., B. Jin and D. Mulcahy (2008), 'Impact of carbon and nitrogen sources on hydrogen production by a newly isolated Clostridium butyricum W5', International Journal of Hydrogen Energy, 33 (19), 4998–5005
Weibel, D. B. (2008), 'Building communities one bacterium at a time', Proceedings of the National Academy of Sciences, 105 (47), 18075–76
Wu, S. Y., C. H. Hung, C. N. Lin, H. W. Chen, A. S. Lee and J. S. Chang (2006), 'Fermentative hydrogen production and bacterial community structure in high-rate anaerobic bioreactors containing silicone-immobilized and self-flocculated sludge', Biotechnology and bioengineering, 93 (5), 934–46
Wu, X., H. Lin and J. Zhu (2013), 'Optimization of continuous hydrogen production from co-fermenting molasses with liquid swine manure in an anaerobic sequencing batch reactor', Bioresource technology, 136, 351–59
Yokoi, H., T. Tokushige, J. Hirose, S. Hayashi and Y. Takasaki (1998), 'H2 production from starch by a mixed culture of Clostridium butyricum and Enterobacter aerogenes', Biotechnology Letters, 20 (2), 143–4 7
Zeidan, A. A., P. Rådström and E. W. Van Niel (2010), 'Stable co-existence of two Caldicellulosiruptor species in a de novo constructed hydrogen-producing co-culture', Microbial cell factories, 9(1), 102
Zhang, X., X. Ye, K. T. Finneran, J. L. Zilles and E. Morgenroth (2013), 'Interactions between Clostridium beijerinckii and Geobacter metallireducens in co-culture fermentation with anthrahydroquinone-2, 6-disulfonate (AH2QDS) for enhanced biohydrogen production from xylose', Biotechnology and Bioengineering, 110 (1), 164–72
Zhang, X., X. Ye, B. Guo, K. T. Finneran, J. L. Zilles and E. Morgenroth (2013), 'Lignocellulosic hydrolysates and extracellular electron shuttles for H2 production using co-culture fermentation with Clostridium beijerinckii and Geobacter metallireducens', Bioresource technology,147, 89–9 5
Zhao, X., D. Xing, N. Fu, B. Liu and N. Ren (2011), 'Hydrogen production by the newly isolated Clostridium beijerinckii RZF-1108', Bioresource Technology, 102 (18), 8432–36
To cite this paper please use the following details: Santilal, M. (2015), 'Fermentative Hydrogen Production from Molasses Using Pure and Co-cultures of Clostridium butyricum and Clostridium beijerinckii by Batch Study', Reinvention: an International Journal of Undergraduate Research, Volume 8, Issue 2, http://www.warwick.ac.uk/reinventionjournal/issues/volume8issue2/santilal Date accessed [insert date]. If you cite this article or use it in any teaching or other related activities please let us know by e-mailing us at Reinventionjournal at warwick dot ac dot uk.