Utilisation of Fluctuations in the Intensity of Reflected Light to Discriminate Amongst Different Road Surfaces
by Craig M. Gladman, Troy S. J. Boellaard, Kerry J. McManus and Aaron S. Blicblau[1], Department of Engineering and Industrial Sciences, Swinburne University of Technology
Abstract
The most significant development in modern braking is the Anti-lock Braking System (ABS) The intervention of ABS, however, is not always advantageous. Major limitations arise when ABS is applied on loose unsealed surfaces such as gravel and sand. In the event of wheel ‘lock up’ on unsealed surfaces, the loose material forms a wedge in front of the tyre which contributes an additional braking force and results in shorter stopping distances. This paper considers the problem of distinguishing amongst various types of road surface by means of the Power Spectral Density (PSD) of fluctuations in the spectra of the intensity of laser light reflected from the road surface. To measure these fluctuations, a test rig was constructed consisting of a visible light laser diode coupled with a light-to-voltage sensor. By mounting the sensor at a height comparable to a vehicle under body and passing it over simulated road surfaces, it is possible to generate power spectral density charts for specific surfaces. It was discovered that each of the road surfaces tested had characteristic power spectral density charts, which could be used to discriminate between surfaces.
Keywords: Anti-lock Braking System, sensor, unsealed surfaces, visible light spectral analysis, gravel, discriminate
Introduction
Anti-lock Braking Systems (ABS) activate to minimise accidents when a vehicle undergoes skidding or experiences wheel lock-up. On sealed roads where there is no loose material present, ABS significantly reduce stopping distances and maintain directional stability (Broughton and Baughan, 2002). When a vehicle experiences lock-up on a surface that is not sealed, such as loose gravel or sand (National Association of Australian State of Road Authorities, 1980b), it can be shown that the intervention of ABS is not desirable and can result in an increase in the stopping distance of the vehicle.
On unsealed surfaces with loose material present, the loose material forms a wedge in front of the skidding wheel and provides an additional braking force (National Association of Australian State of Road Authorities, 1980a). The additional braking force results in a shorter stopping distance. In vehicles equipped with ABS the wedge of loose material does not form as the wheel does not lock and continually rolls over any wedge generation.
There have been a number of investigations undertaken to discriminate between varying road surface conditions, and research has followed several avenues. Early work by Ciamberlini et al. (1995) used an optoelectronic apparatus involving absorption, reflection and scattering properties of near infrared light to discriminate between dry, wet, icy, and moist conditions. In other work, Sasada et al., (2000) utilized radiometers to determine road surface conditions. This technique allowed road surface conditions to be monitored by measuring the emissivity of the test surface. In addition, Birch (1993) developed a system capable of detecting road surface conditions by measuring the force signals experienced from the road. In addition, Garai et al. (1988) developed a procedure for measuring the sound absorption of road surfaces as a means of determining surface characteristics.
Several researchers have addressed the problem of extended stopping distances for ABS-equipped vehicles on unsealed surfaces. Both Korolis et al. (2001) and McManus et al. (2003) investigated methods of detecting wedge build-up in front of a skidding tyre. Image analysis was utilized by Korolis et al. (2001), while McManus et al. (2003) used an infrared distance measurement system to identify and measure the build-up of gravel in front of the tyre. Other workers at Swinburne University (Samuels et al., 2002) utilized used a high-intensity infrared light-emitting diode coupled with a photodiode to monitor the scatter of light off different surfaces.
This paper investigates the use of visible light spectral analysis to discriminate between sealed and unsealed surfaces, where the spectra can be considered to be fluctuations in the intensity of light reflected from the surface. Furthermore, the paper will investigate the possibility of using spectral analysis to discriminate between the varying degrees of roughness associated with unsealed surfaces.
ABS Control System
ABS uses an electronic control unit (ECU) to analyse peripheral wheel deceleration and acceleration supplied from wheel mounted sensors (Austin and Morrey, 2000). From this information the ECU can calculate the reference speed and deceleration of the vehicle. The reference speed corresponds to the speed under optimum braking conditions (optimum brake slip), and is used as a basis for brake slip, which cannot be measured directly (Korolis et al., 2001).
The ECU is capable of discerning if one or more wheels are slipping by comparing wheel speed to the reference speed of the vehicle; when the wheel speed is less than the reference speed, the wheel is slipping. When slipping is first detected the ECU will trigger a reduction in brake pressure to allow the wheel to accelerate back towards vehicle velocity. The ECU will rapidly apply and release the brake pressure in this manner to avoid slippage from occurring.
As ABS prevents the wheel from sliding over a surface it does not allow the build-up of a potentially beneficial wedge of loose material. Detecting the presence of loose material prior to activation of the ABS algorithm will be beneficial to the braking performance of vehicles on unsealed roads without affecting the performance of ABS on sealed surfaces.
Experimental Procedure
A test rig was constructed consisting of a rolling trolley with a mounted oscilloscope and dual power supply. Three new road surface test beds were used in testing which resembled typical road surfaces within Australia; test beds were all 800mm x 400mm x 60mm in size. All surfaces were tested in dry and wet conditions. The water absorption for wet testing was 1000mL (±50mL) per test bed. The surfaces tested were 7mm, 10mm, 14mm, and 20mm aggregate gravel road surfaces obtained from a commercial aggregate supplier.
Testing was undertaken in both wet and dry conditions. Upon commencement of testing the test rig was released and allowed to roll down the ramp, achieving an average speed of 3.7km/h. The road surface test bed was placed under the test rig as shown in Figure 1, whilst the laser/sensor assembly is shown in Figure 2.
The laser was located in a black surface detection box beside the sensor and mounted at a height of 250mm, which resembles the height of a vehicle under-body (Figure 2). The laser diode has a wavelength of 630nm and was run from the dual power supply at 4 volts, with a maximum power output of < 1 mW. The Taos light to voltage sensor (LTV) is also located in the black surface detection box beside the laser at a height of 250mm above the testing surface. The sensor was selected because of its sensitivity to visible laser light. A 15mm diameter 50mm long collimated tube was used in conjunction with the sensor in order to screen out unwanted light. The LTV sensor combines a photodiode and transimpedance amplifier on a single monolithic integrated circuit. The sensor provides a linear analogue voltage output that is proportional to light intensity. The output voltage is directly proportional to the visible light intensity of the visible light laser diode. The sensor has a rise time of 160μs, responsivity of 1820mV/(μW/cm2) at 635nm and a spectral response between 350-1000 nm. A Hewlett Packard 54600B Oscilloscope with an HP Benchlink cable was employed for data collection. The oscilloscope was adjusted to the settings in Table 1. With the collimated laser beam set at an optimum angle to interact with the sensor it was possible for variations in reflected light to be registered up to 250mm from the surface.
| Trigger Mode | Single |
| Secs/Div | 200m/sec |
| Volts/Div | 20mV |
| Sampling Frequency | 500Hz |
| Horizontal delay | 1sec |
Table 1: Oscilloscope Settings
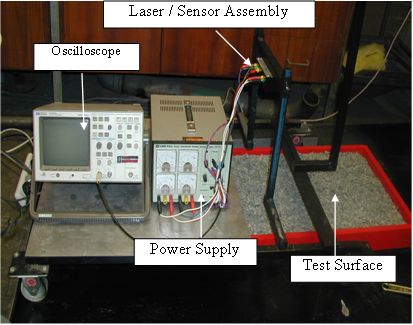
Figure 1: Road surface detection test rig
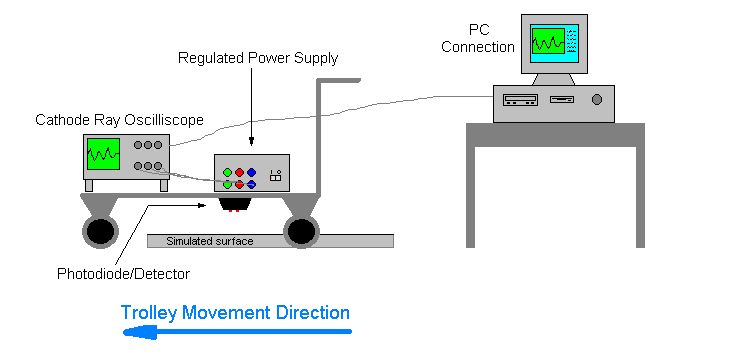
Figure 2: Schematic diagram of the laser/detector system sensor assembly
[Click on image for full-size version]
The sensor assembly was mounted downwards and the rig was passed over the varying test bed surfaces. During testing the trolley was rolled down a ramp made from 10mm Medium Density Fibreboard at an incline of 9° in order to reach an average speed of 3.7 k/mh over the testing distance. Although there is a need for a correction to obtain invariant spatial spectra from the velocity or acceleration dependent temporal spectra actually recorded, this was outside the context of the work, and should be incorporated in future work of this type.
The oscilloscope was manually triggered at a set point shortly after release to record a full sweep of the test surface. Each surface condition was tested 30 times with a voltage/time output achieved for each test. By linking the oscilloscope to the personal computer via HP Benchlink it was possible to save the oscilloscope output as a Comma Separated Variable (CSV) file. The data was then transferred into Matlab for analysis as a two-column array, consisting of voltage and corresponding time values. In order to analyse the data, the time domain was changed to a frequency domain using the Fast Fourier Transformation (FFT) method. FFT involves resolving a signal into simple frequencies by expressing the value of frequency components spectrum (Onosokki, 2009). The spectrum command, utilizing Welch’s averaged periodogram method to estimate the power spectral density (Matlab, 2009) was employed to estimate the power spectral density.
Results and Discussion
The data from 30 passes of the surface test bed were analysed and spectral density charts produced. The power spectral density was calculated for each of the 30 passes and an average was determined with MATLAB to provide a single power spectral density chart for each of the surface conditions tested. The resulting spectral density charts (Figures 3-7) are shown and discussed below, where the units of the spectral amplitude are arbitrary.
Dry Unsealed Gravel Road Surface
Figure 3 demonstrates the spectral densities associated with unsealed road surfaces consisting of varying size aggregate gravel. The amplitude of the spectral density is distinctly different for each of the unsealed surfaces. There is a clear correlation between the amplitude and surface roughness; 20mm aggregate gravel displays the highest peak amplitude and 7mm aggregate gravel shows the lowest peak amplitude.
All the surfaces experienced peak amplitude at a frequency less than 5Hz, this figure would be larger for a system tested at road speeds as the laser would be passing over the surface at a much greater velocity. Theoretically the trend displayed in Figure 3 would not change.
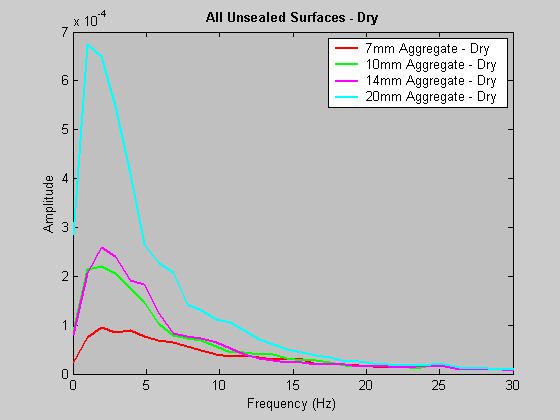
Figure 3: Spectral density chart for all dry unsealed gravel road surfaces (Frequency scale 0 – 30Hz)
The 20mm aggregate gravel experiences its peak amplitude within a relatively smaller frequency range compared to the other surfaces, suggesting the larger gravel surface possesses more uniformity than the smaller surfaces. Comparatively, the 7mm aggregate gravel surface covers a much broader frequency range. This is due to the smaller gravel surface lacking the distinct peaks and troughs provided by the larger aggregate surface. The light returning to the sensor from the 7mm gravel is much more random due to the non-uniformity of the smaller gravel surface. This results in a power spectral density spread evenly over a larger frequency range. The peak amplitude and frequency distribution for the 10mm and 14mm aggregate gravel surfaces fall in between these two extremes.
Wet Unsealed Gravel Road Surface
Figure 4 compares the power spectral densities for all the unsealed wet gravel road surfaces. The trend that was established with the dry unsealed gravel road surfaces in Figure 3 is continued with the wet unsealed surfaces.
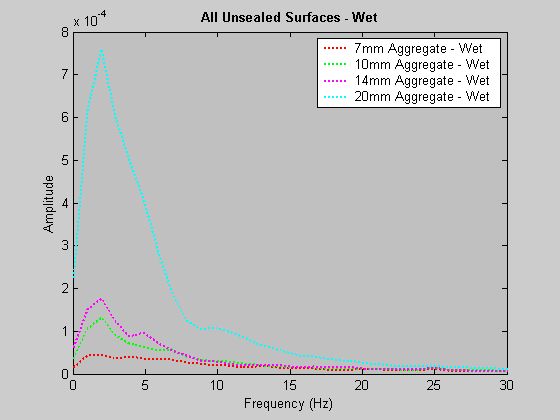
Figure 4: Spectral density chart for all wet unsealed gravel road surfaces (Frequency scale 0 – 30Hz)
The 20mm aggregate gravel remains the surface with the highest spectral density amplitude. The remaining surfaces, when wet, displayed progressively smaller peak amplitudes as the gravel size reduced and the surface became smoother. The frequency spread for each of the wet surfaces also increased as the surfaces become smaller with less uniformity in their distribution.
Dry Unsealed Vs Wet Unsealed Gravel Road Surface
As shown in Figure 5, wet surfaces display smaller peak amplitudes, compared to their dry surface counterparts at the same frequency. It is most likely that the water changing the colour of the surface is responsible for this occurring. As the gravel surface appears darker with the addition of water its ability to reflect the laser light decreases, resulting in a weaker signal being detected by the sensor.
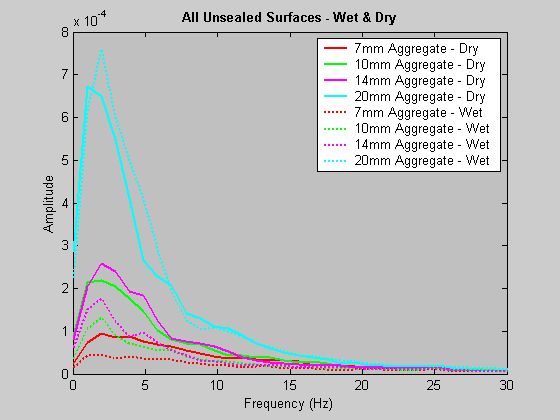
Figure 5: Spectral density chart for all unsealed surfaces wet and dry (Frequency scale 0 – 30Hz)
As can be noted from Figure 5, the shape of the spectral density distribution for each wet surface is similar to the corresponding dry surface. Providing the surface profile has not changed, the frequency distribution should remain the same irrespective of surface condition.
The exception to the above observation is the 20mm aggregate surface. Table 2 shows the wet 20mm aggregate surface reaching a larger peak amplitude than the dry surface. This can be explained by the tendency for the 20mm aggregate to contain small pools of water in the crevices of the individual pieces of larger gravel. In the event of the laser beam crossing a pool of water the intensity of reflected light returning to the sensor is greater and the frequency characteristics differ.
| Surface | Dry Road Surface | Wet Road Surface | ||
| Peak Amplitude* (10-4) |
Frequency (Hz) | Peak Amplitude (10-4) |
Frequency (Hz) | |
| 7mm | 1.0 | 2.1 | 0.5 | 1.4 |
| 10mm | 2.4 | 2.1 | 1.3 | 1.9 |
| 14mm | 2.6 | 2.3 | 1.8 | 2.1 |
| 20mm | 6.7 | 1.3 | 7.6 | 2.2 |
| Bitumen | 0.1 | 2.3 | 1.7 | 2.0 |
Table 2: Peak amplitude and frequency at peak amplitude for all surfaces, Wet and Dry
*(the units of the spectral amplitude are arbitrary)
Dry Sealed Road Surface Vs Wet Sealed Road Surface
The power spectral density for the wet surface in Figure 6 is more characteristic of a spectral density distribution for water.
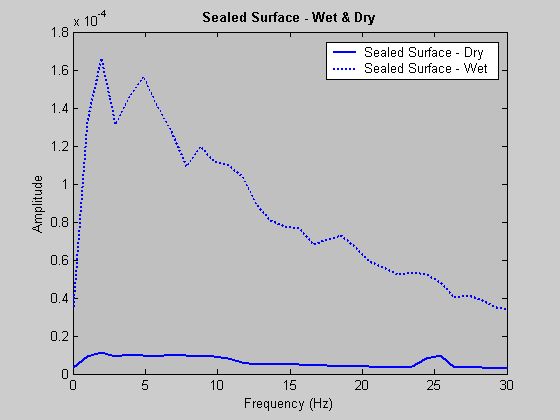
Figure 6: Spectral density chart for Bitumen, Wet Vs Dry (Frequency scale 0 – 30Hz)
The sealed surface has been looked at separately as it does not consist of loose material and exhibits different characteristics to the unsealed surfaces. The low values measured on the dry sealed surface are due to the absorption by the bitumen (black) and the high values on the wet sealed surface to specular reflections on the surface of the water as shown in Table 2. Water is a much more reflective surface compared to the black bitumen surface so the intensity of light reaching the LTV sensor is much greater. As can be seen from Fig 6 the most common frequency provided by the dry sealed surface is between 0 and 10Hz. However, unlike the unsealed surfaces the sealed bitumen surface also has a relatively uniform frequency distribution up to the 30Hz limit.
Dry Sealed Vs Dry Unsealed
Figure 7 shows a comparison between all the dry road surfaces tested. There is a distinct difference in spectral density amplitude between the smallest unsealed surface (7mm) and the sealed surface (bitumen). This suggests that this system can be used to differentiate between sealed surfaces and unsealed surfaces.
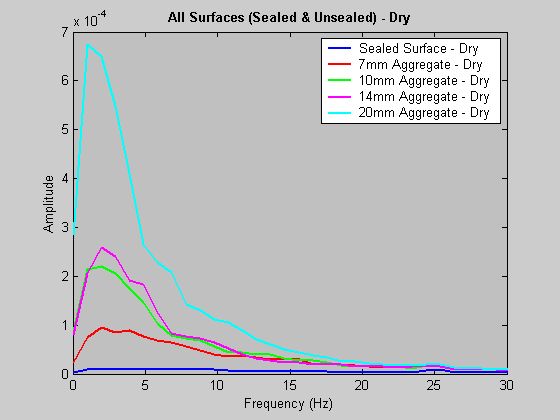
Figure 7: Spectral density chart for all dry surfaces, sealed and unsealed (Frequency scale 0 – 30Hz)
Limitations
The following limitations could adversely affect the performance of the system.
Obstructions between the road surface and the sensor unit.
It may be possible for interfering mediums such as dust, fog, and mud to come between the light to voltage sensor and the road surface.
Mixes amongst types of gravel
Roads may have a mix of different types of gravel; responses from these different surfaces may give altered results, which will need to be determined for this system to be viable. The difference observed between the various gravel surfaces may be due to a difference in macro-texture (angularity of the aggregates, orientation, gaps between them, shadows) and would need to be further investigated to for additional results which may be obtained with different stones having different micro-texture and absorption characteristics.
Tested at relatively small speeds
The test rig travels at a speed of approximately 4km/h compared to speeds of 110km/h and beyond encountered in passenger vehicles.
Interference from other light sources
Varied frequencies of light can influence the signal received by the sensor. This limitation may affect the Road Surface Detection unit in places such as tunnels and garages.
Vehicle acceleration
To date the road surface detection system has only been tested at a constant velocity.
Water on the road surface
The pooling of water on sealed surfaces can radically change the spectral density output leading to false identification of surfaces.
Conclusions
A system has been developed to differentiate between varying road surfaces by coupling a visible light laser diode with a light to voltage sensor. The main result is that there are significant differences between the PSDs of different surfaces, most importantly between sealed surfaces and loose aggregate surfaces, and that these differences may be of use in tailoring the response of anti-lock braking systems. The information provided by this work can be applied as an input to the ABS algorithm to change the braking characteristics of vehicles. The sensor has been situated at height comparative to a vehicle under body to more realistically represent real life driving conditions. It can be clearly seen from the results that as the surface roughness increases the peak amplitude of the power spectral density increases accordingly. Sensors can be mounted on both driver and passenger sides to detect when a vehicle is driving half on a sealed surface and half on an unsealed surface as commonly encountered on single lane country roads. This information could be used to adjust the braking characteristics for each side of the car independently. The technology may be applied to improve existing road surveillance equipment and would be invaluable in improving the performance of modern braking systems.
Recommendations
The research has proven that by coupling a visible light laser diode with a light to voltage sensor it is possible to generate power spectral density curves that are clearly unique to a specific road surface condition. The following is an overview of work that is imperative to the system’s future success.
Testing a greater range of surfaces
There are still surfaces such as sand, snow, mud, and dust that need to be tested. Testing of mixed gravel surfaces is required to determine if a mixed surface will display characteristics corresponding to the largest or smallest aggregate gravel component, or possibly an entirely new spectrum response.
Interference from external light sources
Fluorescent light commonly encountered in tunnels will generate a spike on the spectral density chart at the frequency they operate. By modulating the laser at a frequency not likely to be encountered elsewhere, it is possible to integrate a band filter into the LTV sensor, which will effectively eliminate any interference from external light sources.
Testing under driving conditions
The research would benefit from testing the unit’s response when exposed to the rigors of the driving environment. Of particular interest would be the effect of greater velocity and chassis vibration.
The effect of accelerations and decelerations on the system is unknown but is likely to have an adverse affect on the spectral density outputs. Changing the rate that the system moves over the surface will change the shape of the frequency distribution.
Positioning of the system
Positioning of the Road Surface Detection unit is crucial to the overall effectiveness of the system. By positioning the system ahead of the front tyres it will be possible to avoid some of the problems associated with dirt, dust, and mud affecting the sensory equipment.
Surface gravel size on braking
Investigations are required in to the amount of loose surface material that is required to be present before it becomes beneficial to the braking performance of the vehicle.
Laser Selection
The visible light laser diode must be cost effective to ensure full-scale production is viable. The laser must comply with the Australian standard AS/NZS 2211.1:2004 [8], which outlines the laser must be a class 2 laser or below to ensure it can safely be exposed to the general public. The laser must still provide sufficient light intensity to provide a clear reflected signal to the LTV sensor.
Acknowledgements
Two of the authors (C.M. Gladman and T.S.J. Boellaard, who were final-year mechanical engineering students at the time this paper was written) wish to acknowledge the assistance of Professor Peter Cadusch for his advanced knowledge of electrical components, spectral analysis and Matlab programming; Walter Chetchetti for technical assistance and Tom Melvin from Boral Asphalt for the donation of different aggregate gravel as well as his assistance and expertise in road surfaces.
Notes
[1] Craig M. Gladman graduated with a bachelor of Engineering ( Mechanical) and is now working as a mechanical engineer.
Troy S. J. Boellaard graduated with a bachelor of Engineering ( Mechanical) and is working as a mechanical engineer.
Kerry J. McManus is an adjunct professor at Swinburne University of Technology.
Aaron S. Blicblau is a senior lecturer at Swinburne University of Technology.
References
Austin, L. and D. Morrey (2000), ‘Recent advances in antilock braking systems and traction control systems’, Proceedings of the Institution of Mechanical Engineers, Part D: Journal of Automobile Engineering, 214 (6), 625-38
Birch, S. (1993), ‘Smart Tyres’, Automotive Engineering International 70 (2), 109-12
Broughton, J. and C. Baughan (2002), ‘The effectiveness of antilock braking systems in reducing accidents in Great Britain’, Accident Analysis and Prevention, 34 (3), 347-55
Ciamberlini, C., G. Innocenti and G. Longobardi (1995), ‘An optoelectronic prototype for the detection of road surface conditions’, Review of Scientific Instruments 66, 2684-89
Garai, M., M. Berengier, P. Guidorzi and Ph. L'Hermite (1988), ‘Procedure for measuring the sound absorption of road surfaces in situ’, in Proceedings of Euro-Noise’98, Munich, Germany, 1998, pp. 819–24
Korolis, J., M.Young, A. S. Blicblau and K. J.McManus (2001), ‘Image analysis applied to discriminate between sealed and unsealed road surfaces’ in Urban Transport VII Transaction: The Built Environment volume 52 (ed. L. J. Sucharov and C. A. Brebbia), Wessex Institute of Technology, Great Britain: Lemnos, Greece
MATLAB (2009). Technical Computing, http://www.mathworks.com/products/matlab/technicalliterature.html, accessed 7 October 2009
McManus, K. J., A. S.Blicblau, C.J. Broadhurst and A.M.S. Carter (2003), ‘Real-Time Detection of Unsealed Surfaces During Skidding’, Transportation Research Record: Journal of the Transportation Research Board Volume 1819A, 237-43
National Association of Australian State Road Authorities (1980a), Pavement Materials - Part 2 Natural gravel, Sand clay and soft and Fissile rock, Sydney: NAASRA, pp. 20-22
National Association of Australian State Road Authorities (1980b), Pavement Materials – Part 4 Aggregates, Sydney: NAASRA, pp. 6-11
Onosokki (2009). Fast Fourier Transform, http://www.onosokki.co.jp/English/hp_e/products/application/tach/index.htm, accessed 7 October 2009
Samuels. J. S., D. J. McGoldrick, M. D. Humphry, A. S. Blicblau and K. J. McManus (2002), Infrared road surface detection used as an ABS switch, School of Engineering and Science, Swinburne University of Technology: Hawthorn
Sasada, Y., T. Kitano, S. Owaki and M. Mishima (2000), ‘Detection of road surface conditions by 95GHZ band radiometer’, NEC Research and Development, 41 (1), 69-73
To cite this paper please use the following details: Gladman, C. M., Boellaard, T. S. J., McManus, K. J. and Blicblau, A. S. (2009), ‘Utilisation of Fluctuations in the Intensity of Reflected Light to Discriminate Amongst Different Road Surfaces', Reinvention: a Journal of Undergraduate Research, Volume 2, Issue 2, http://www.warwick.ac.uk/go/reinventionjournal/issues/volume2issue2/gladman Date accessed [insert date]. If you cite this article or use it in any teaching or other related activities please let us know by e-mailing us at reinventionjournal@warwick.ac.uk