
Absorbance Spectroscopy (UV-visible)
Absorbance is the logarithm of the ratio of intensities of light incident on a sample and light transmitted through it. The most common application of UV/visible absorption spectroscopy is to determine the concentration of a species in solution using the Beer-Lambert law.
How does it work?
The normal method of measuring a UV-visible absorbance spectrum is to place a sample in a quartz or glass (depending on how far into the UV one requires data) cuvette and insert it into a UV absorbance spectrometer. Data for the solvent in a matched cuvette should be subtracted from the measured spectrum either automatically or manually.
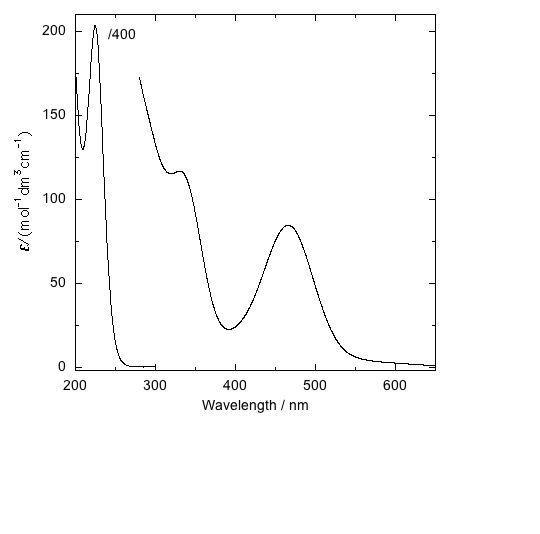
In practice, in a collection of molecules, the photons absorbed by different molecules will be of slightly different energies so what we measure is a curve where the signal that is plotted is a measure of the probability that a transition will occur at that energy (or wavelength). Such a plot of the absorbance of light versus wavelength is known as an absorption spectrum.Applications:
Absorbance spectroscopy gives some indication of electronic structure but is most often used to determine concentrations of samples using the Beer-Lambert Law. It is also a good idea to measure an absorbance spectrum of a sample before measuring a circular or linear dichroism spectrum.
Sample handling requirements:
Usually solutions where the analyte has a maximum absorbance of 2 in the region of interest. Buffer or other matrix components should not have a significant absorbance. Typical concentrations range from 0.1–1 mg/mL for a 1 mm or 1 cm cuvette.
Complementary techniques:
Warwick expertise:
Absorbance spectroscopy is a very common technique and many instruments are available at Warwick some of which are available for external use and some are not. Which ones are available will depend on the application of interest and the support required.
Contact:
Claire Gerard: / 07385 145064