
By Nicholas Crafts
To judge from the 2019 general election campaign, the country has grown weary of austerity. With an historical perspective, this is not surprising, once we recognise the exceptional dimensions of the 2010s’ fiscal squeeze. Dealing with the fiscal aftermath of a major banking crisis was a new and painful experience for the UK.
The idea of this article is simply to provide some historical perspective on the austerity policies of the 2010s. I make no attempt to evaluate macroeconomic policy. Rather, I make comparisons with two previous episodes of austerity, namely the early 1930s, when the government struggled to cope with the budgetary implications of the external shock of a world economic crisis, and the early 1980s, when the government sought to conquer domestic inflation pressures with its Medium-Term Financial Strategy.
The austerity measures of 2010 were different to those of previous decades, and centred on how to deal with the fiscal consequences of a banking crisis the like of which had not happened in Britain for well over a hundred years. Cuts to government expenditure were deeper, the period of austerity longer, and the impact on public spending and services more keenly felt than ever before.
The context for austerity in 2010
It was widely accepted in 2010 that the aftermath of the banking crisis entailed a serious structural budget deficit, i.e. one that would persist even after recovery from the initial shock to aggregate demand. The crisis had reduced the level of potential output compared with the counterfactual of no crisis implicit in previous fiscal plans, and thus would raise government outlays and lower government receipts relative to GDP. Both the outgoing Labour and incoming Coalition governments thought that the structural budget deficit had risen by around 6% of GDP to somewhere near 8%. The IFS Green Budget in 2010 pointed out that this implied a threat to future fiscal sustainability, with the public debt to GDP ratio rising to 120% by the mid-2020s and 160% by 2040 on unchanged policies. Both the outgoing and incoming governments accepted the case for serious fiscal consolidation to maintain fiscal sustainability, although the parties differed on its composition, size and timing. So, to a considerable extent, austerity was a bi-partisan policy, although there certainly was enough fiscal space to allow some flexibility as to how to implement it.
Some fiscal facts
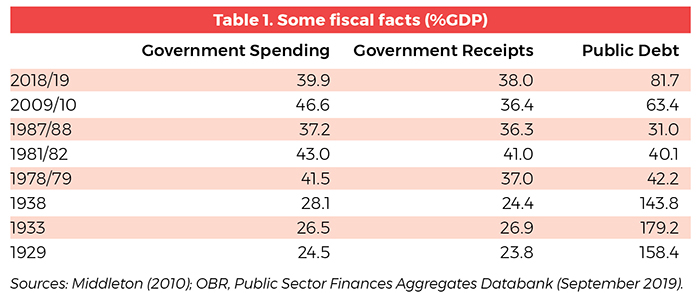
Table 1 shows that by 2018/19, total government spending had been reduced to 39.9% of GDP compared with 46.6% in 2009/10. The level in 2018/19 was about the same as the pre-crisis years in the mid-2000s or the early 1970s, but much larger than in the interwar years. Government receipts (predominantly tax revenues) in 2018/19 as a share of GDP at 38% were modestly larger than in 2009/10 but not since 1985/86 had this ratio been exceeded, although a total tax take of this magnitude was fairly typical of the 20 years prior to that.
The length of austerity
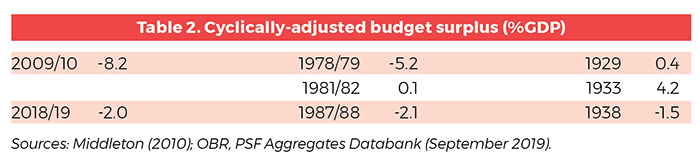
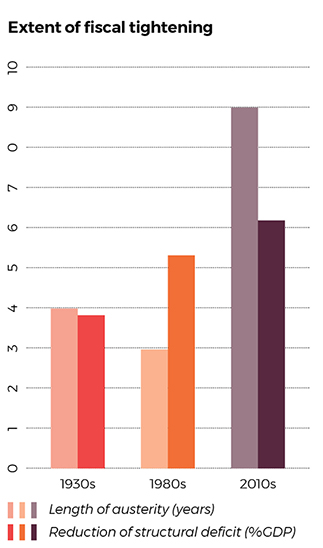
The cyclically-adjusted budget surplus, which is monitored by the Office for Budget Responsibility, is equivalent to the structural budget deficit. When the economic environment is not subject to major shocks, changes in this ratio (reported in Table 2) reflect discretionary changes in the government’s fiscal stance – an increase in the surplus (decrease in the deficit) would reflect greater austerity. On this measure, fiscal tightening continued for the whole of the 9-year period from 2009/10 to 2018/19 by which point it amounted to 6.2% of GDP, i.e. about the same amount required to repair the initial estimate of the increase in the structural budget deficit from the banking crisis. By comparison, in the Thatcher years, austerity only prevailed for three years before fiscal policy was relaxed somewhat and in the 1930s the reversal of austerity started in 1933 after four years. In both cases the full extent of fiscal tightening was smaller than in the 2010s; 5.3% and 3.8% of GDP respectively.
Public spending and services
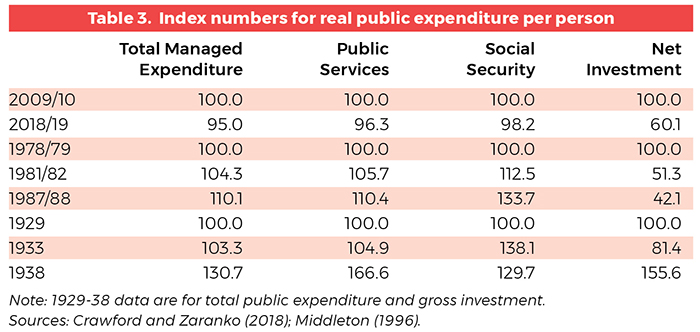
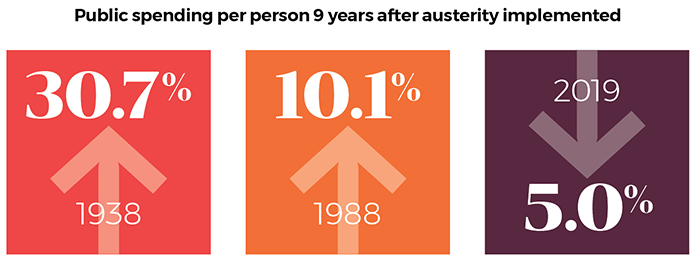
So, the austerity of the 2010s lasted much longer and amounted to a bigger fiscal squeeze than was imposed either in the 1930s or the 1980s. This resulted in a much colder climate for public spending in the recent past, as can be seen in Table 3. Comparisons can be made for the periods of fiscal tightening or over 9 years from the start of austerity in each case. Either way, the point that stands out is that 2009/10 to 2018/19 is the only period in which there were decreases in total managed expenditure per person and a key component of this, spending on public services per person, by 5% and 3.7% respectively. In 1933 and in 1981/2 these items showed small increases since the period of austerity began. By 1938, total managed expenditure per person was 30.7% above the 1929 level and by 1987/8 it was 10.1% above the 1978/9 level.[1]
The reductions in public spending per person in the 2010s reflect a decision to impose fiscal consolidation very largely (>80%) through expenditure cuts rather than tax increases. They comprise some big cuts to parts of the public sector especially since health has been protected – each of the government departments Culture, Defence, Environment, Food and Rural Affairs (DEFRA), Education, Home Office, Justice, and Transport has had a real-terms cut of at least 10%. They are also the context for spending cuts of more than 40% in some localities by the time of the EU referendum.
Household income inequality
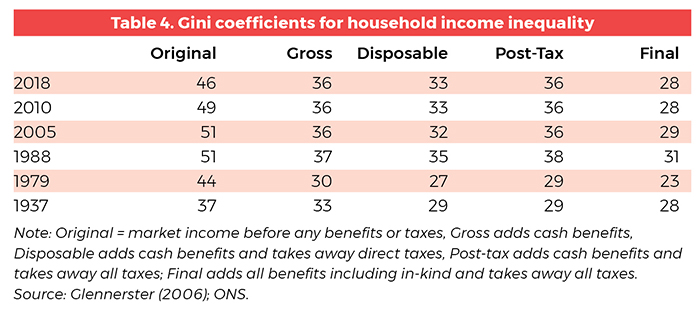
Even so, after this long period of expenditure-focused austerity in 2018, the redistributive function of fiscal policy working through expenditure rather than taxation was still very clear if less pronounced than pre-crisis. As is reported in Table 4, this reduced the Gini coefficient for household income inequality from 46% for original income to 28% for final income compared with 51% to 29% in 2005. Inequality in final income was the same as in 2010. Redistribution was still on a much more ambitious scale than with the smaller state of the 1930s.
This time was different. Fiscal tightening was protracted and the reduction in the structural budget deficit was unusually big. The austerity programme was implemented at a time of unprecedented productivity slowdown and this entailed cuts in real public spending per person. Re-balancing the public finances in the aftermath of a banking crisis proved an order of magnitude more demanding than a common-or-garden fiscal consolidation.
Footnotes
[1] In the later 1930s, public spending was driven up by rearmament which began in 1935. Both in the 1980s and in 1933, social security spending reflected high unemployment which did not return in the 2010s.
This article was published in Advantage Magazine: Austerity, 10th Anniversary Special, Summer 2020.
About the author
Nicholas Crafts is Professor of Economic History at the University of Sussex Business School, Emeritus Professor of Economics at the University of Warwick, and Senior Research Fellow of CAGE.
Further reading
Crawford, R. and Zaranko, B. (2018), Trade-offs for the forthcoming Spending Review, IFS Green Budget, 118-152
Glennerster, H. (1996) Tibor Barna: The Redistributive Impact of Taxes and Social Policies in the UK, Centre for Analysis of Social Inclusion (CASE) Papers, LSE
Middleton, R. (1996), Government Versus the Market: The Growth of the Public Sector, Economic Management and British Economic Performance, c.1890-1979, Cheltenham: Edward Elgar.
Middleton, R. (2010), ‘British monetary and fiscal policy in the 1930s’, Oxford Review of Economic Policy, 26 (3): 414-441.
Office for Budget Responsibility (September 2019), Public Finances Databank