
Official statistics underestimate wealth inequality
Official statistics underestimate wealth inequality
Friday 7 Jan 2022The latest statistics on Household Total Wealth in Great Britain from the ONS are a welcome but limited insight into what has been happening to wealth in Great Britain. Limitations in survey response means they will underestimate the share of wealth at the top. While they will not tell us what has happened as a result of the pandemic, we can use them to provide an educated guess.
On Friday, the ONS will release their latest figures on what has been happening to wealth in Great Britain. These numbers are already out of date, covering only the period up to March 2020, and therefore missing the effects of the COVID pandemic. But they are also limited in another way: they underestimate the share of wealth going to the richest households. Given the debates about wealth inequality, discussion about wealth taxes to pay for COVID, and the growing importance of inherited wealth as a share of lifetime resources, it is important to get this right.
Looking back at the past 12 years of the ONS survey, the figures show that total wealth in Great Britain has risen from £10.4tn to £14.6tn (in 2016–18 prices), meaning average household wealth in Great Britain has risen from £402,100 to £564,300. Over the same period, the share of all wealth held by the wealthiest 10% of households has risen very slightly, from 44% to 45%.
Top wealth is higher than officially reported
However, these figures have two problems. First, they do not include business wealth, which is an important source of wealth for the wealthiest households. Second, they substantially under-record the total wealth held by those wealthy households, since, unsurprisingly, the very wealthy do not tend to respond to such surveys and so are not well-represented.
Adjusting the data to account for business wealth – which is measured in the survey but excluded from official statistics – we find that total wealth in Great Britain is £0.7tn higher in 2016–18. This is about 5% of the current estimate, and the proportional underestimation has been similar back to 2010–12. Adding in wealth observed in the Sunday Times Rich List, and using a statistical approach to correct for the under-representation of other wealthy households, total wealth is higher still, by £0.5tn in 2016–18. Total GB wealth is therefore underestimated in the ONS figures by about 8%.
After making these adjustments, the level of inequality is also higher (Fig 1). Adding business wealth into the calculation, the share of wealth owned by the wealthiest 10% of households actually rises significantly, by 2 percentage points. Consistent with the ONS figures, this has remained broadly steady over the period. Correcting for missing wealth at the top, we find the share of wealth going to the top 10% is further increased slightly, to around 47%, and still flat.
Figure 1: Share of wealth held by the wealthiest 10% of households
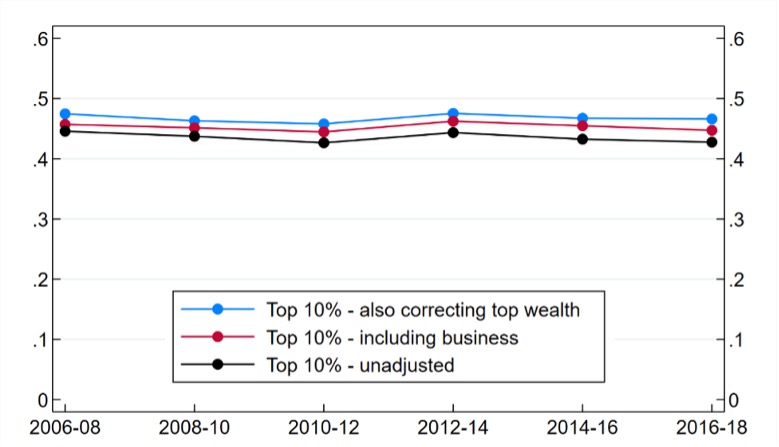
Notes: Constructed using data from the Wealth and Assets Survey (WAS) and the Sunday Times Rich List (STRL). ‘Including business’ adds business wealth to the ONS measure of wealth used in official statistics. ‘Also correcting top wealth’ additionally includes the wealth from the STRL and a ‘Pareto correction’ for under-reported wealth among the wealthiest households. See Advani Bangham and Leslie (2021)Link opens in a new window and Advani Hughson and Tarrant (2021)Link opens in a new window for details of the correction method. Top shares are measured at household level, consistent with the ONS.
Political movements after the Financial Crisis, and the work of economists like Thomas Piketty, have favoured looking at wealth concentration among smaller groups – specifically the top 1% wealthiest households. The ONS does not provide figures for the share of wealth going to this group. Constructing this measure ourselves, we see the importance both of including business wealth and of correcting for under-coverage at the top. Together these adjustments add around 55% (6 percentage points) to the share of wealth owned by the top 1% in 2016–18 (Fig 2).
Figure 2: Share of wealth held by the wealthiest 1% of households
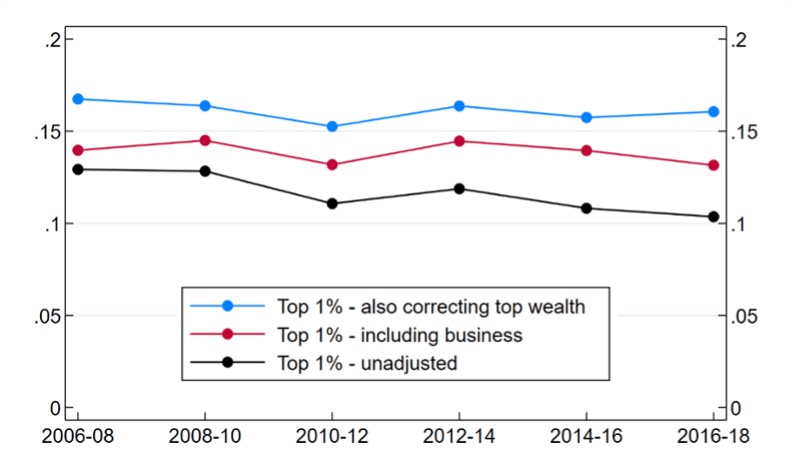
Notes: Constructed using data from the Wealth and Assets Survey (WAS) and the Sunday Times Rich List (STRL). ‘Including business’ adds business wealth to the ONS measure of wealth used in official statistics. ‘Also correcting top wealth’ additionally includes the wealth from the STRL and a ‘Pareto correction’ for under-reported wealth among the wealthiest households. See Advani Bangham and Leslie (2021Link opens in a new window) and Advani Hughson and Tarrant (2021)Link opens in a new window for details of the correction method. Top shares are measured at household level, consistent with the ONS.
Other inequalities in wealth
There are also important demographic differences in wealth holdings that are worth highlighting. Men typically have higher levels of wealth: they hold almost 40% more wealth than women, on average. Wealth is concentrated among older individuals. This is partly because individuals close to retirement have had their whole working life to save, but they also benefitedLink opens in a new window “from both benign economic developments (such as rapid rises in the value of their homes, generous occupational pension provision and decades of healthy wage growth) and generous government policies (such as free university tuition, big tax breaks for pension saving and capital gains on main homes, and the ‘triple lock’ on the state pension).”
Wealth differences between households from different ethnic groupsLink opens in a new window are stark: households whose ‘Household Reference PersonLink opens in a new window’ (HRP, the main respondent to the survey) is of white ethnicity are four times more likely to have wealth in excess of £500,000 than households with a black African HRP. There are important differences in household wealth portfoliosLink opens in a new window too: Pakistani and Indian households are less likely to hold pension wealth, with home ownership being more important in their asset holdings.
Previous analysis by the ONSLink opens in a new window highlights significant regional variation in household wealth. Median wealth is more than 2.5 times higher in the South East compared to the North East. This variation can largely be explained by differences in house prices, with changing house prices contributing to a growing divergence in wealth levels across regions.
Wealth trends since the pandemic
Although these latest figures will not provide direct information on what has happened to wealth since the start of the pandemic, a look at the historic survey data does provide some insight. Dividing the population up into deciles, there are clear differences in asset holdings across the distributionLink opens in a new window. We know that the average house price roseLink opens in a new window by 16% between the start of the pandemic and October 2021, and these gains were middle-weighted (Fig. 3). Falling interest rates also increase the value of pensions, which are similarly middle-weighted. Meanwhile, stock market growth of around a third since the pandemic lows has disproportionately benefited richer households, though the impact of the pandemic on private businesses is less easy to measure. COVID-19 has also led to those at the bottom of the distribution, who experienced the biggest hit to their savings, falling further behind the rest.
Figure 3: Average share of total net wealth contributed from different asset classes by family net wealth decile: GB 2016–18.
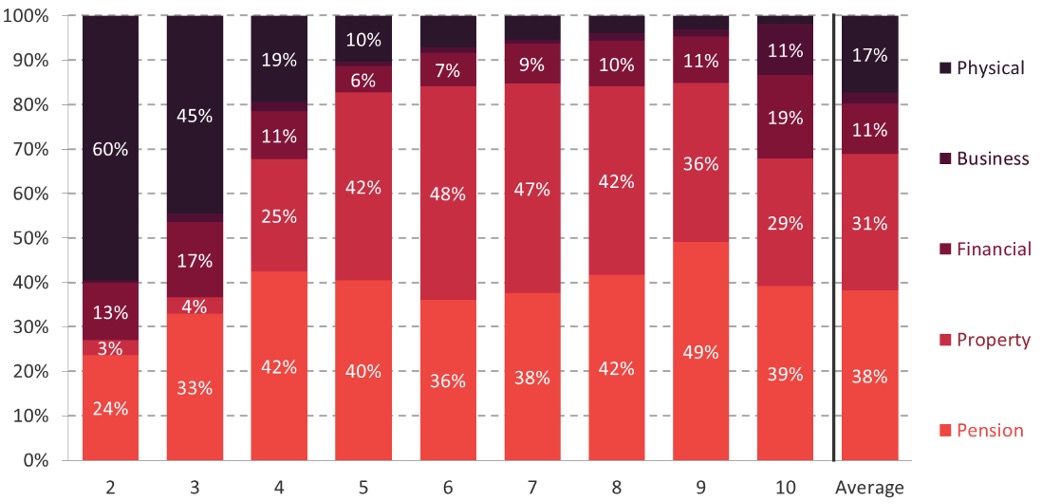
Notes: The lowest decile is excluded as net wealth is negative.
Source: Advani, Bangham and Leslie (2021)
What does this mean for the effects of the pandemic on wealth inequality? Overall, the wealthiest have clearly gained most in cash terms over the pandemic. But apart from among the super-wealthy – where there has been very rapid wealth growthLink opens in a new window – the effect on wealth concentration is likely to be less visible because there are large gains relative to initial wealth for those in the middle as well as those at the top.
Arun Advani, University of Warwick and CAGE
Hannah Tarrant, London School of Economics
This article is also published on the LSE British Politics and Policy Blog