Urban-Biased Structural Change

Urban-Biased Structural Change
Friday 9 Feb 2024This column was originally published on VoxEU and is reproduced with permission.
CAGE Impact Director Professor Dennis Novy, Professor Natalie Chen, Professor Carlo Perroni and Dr Horng Chern Wong discuss the consequences of the shift from manufacturing to services and the impact of this on urban development. Recent research by the authors is published as CAGE Working paper 694/2023.
Economic activity in high-income countries has shifted towards services and away from manufacturing. But research remains scant on the patterns of structural change within countries across urban and rural areas. Using micro data from France, this column shows that the shift towards services has been more pronounced in urban areas. Large services firms have expanded in large French cities, helping boost their productivity and grow their services exports. The rise of services in urban areas has been accompanied by increased land prices and housing costs.
Over the last few decades, high-income countries have witnessed a swift rise in the services share of economic activity. Researchers have largely attributed this structural transformation to a combination of stronger productivity growth in manufacturing relative to services and price-inelastic demand for services, a phenomenon related to Baumol’s cost disease (Herrendorf et al. 2018). In an open economy, international trade can accelerate structural change by encouraging countries to specialise in certain sectors, driven by comparative advantage or economies of scale (Matsuyama 2009, Alessandria et al. 2021).
Uneven structural change within countries
While the literature has focused on explaining trends for economies as a whole, less is known about the patterns of structural transformation within countries across urban and rural regions – and the driving forces behind those regional patterns. Recent evidence suggests that structural change may play out unevenly across domestic regions, as services have become more spatially concentrated over time. Possible causes of uneven structural change within countries include spatially concentrated international trade shocks (Hanson et al. 2016, Fajgelbaum and Redding 2022) and differential changes in agglomeration forces across sectors (Desmet and Rossi-Hansberg 2009).
In recent work (Chen et al. 2023), we study to what extent the structural change from manufacturing to services proceeds unevenly across different regions of the same country. We construct measures of structural change across different commuting zones in France between 1995 and 2018 (we refer to commuting zones as ‘cities’ or ‘areas’). Using detailed micro data on the universe of French firms, we then relate those measures to firms’ characteristics such as their size, exports, and location, unveiling previously undocumented stylised facts about the underpinnings of structural change in France.
Structural change in France is urban-biased
First, we find that structural change is urban-biased: the services share of economic activity has increased more rapidly in bigger French cities, and the manufacturing share has declined more slowly in smaller cities. This is true regardless of whether economic activity is measured in sales, value added, or employment. The urban bias is not unique to Paris, but holds across the distribution of French cities.
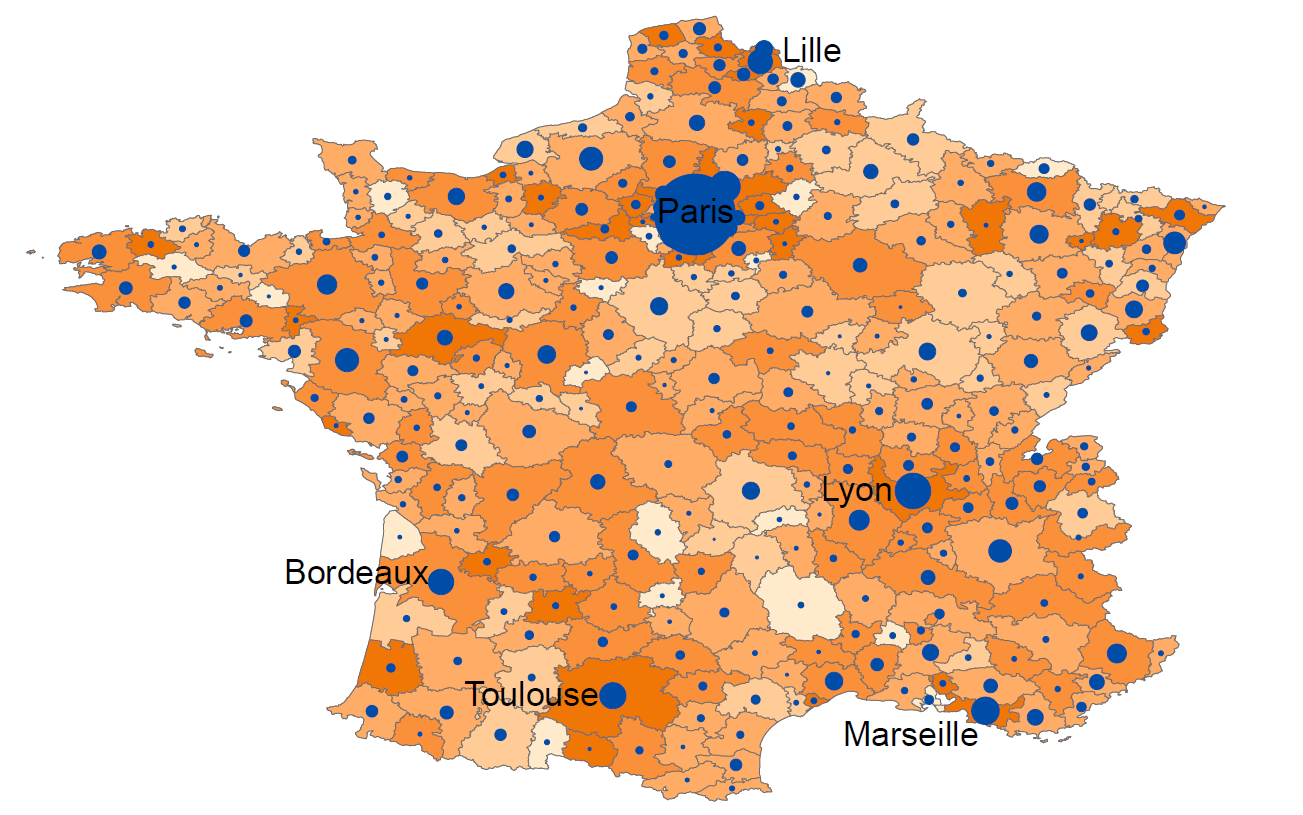
Figure 1 illustrates the positive relationship between population size and the increase in the services share across cities (the darker the orange colour, the stronger the increase in the services share of the local economy).

Notes: The map illustrates city size (population measured as the number of total employees) and the increase in the local services share across 297 French cities (commuting zones) between 1995 and 2018. The dots are proportional to city size. The increase in the services share is depicted in five shades of orange, with the darkest shade corresponding to the strongest increase. In addition to Paris, the labels indicate the five largest cities outside the Paris region; ordered by size, they are Lyon, Marseille, Toulouse, Bordeaux, and Lille.
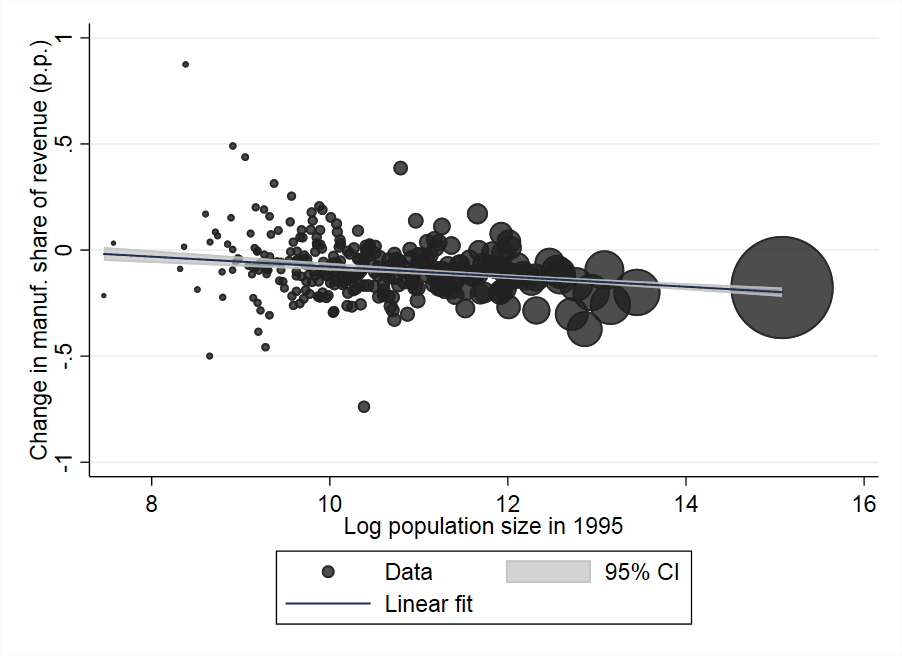
Focusing on the decline of manufacturing, Figure 2 shows the systematic negative relationship between city size and the change in the local manufacturing share across all 297 areas in metropolitan France.

Notes: Figure 2 plots city size (population measured as the number of total employees) against the decrease in the local manufacturing share across 297 French cities (commuting zones) between 1995 and 2018. Each dot represents one French city, proportional to city size in 1995. The largest dot represents Paris. The variable on the vertical axis is the change in the manufacturing share in percentage points. The slope of the regression line is significantly different than zero.
We rule out potential explanations based on composition effects: we find no evidence of changes in comparative advantage away from manufacturing sectors that were more concentrated in big cities in 1995, and no evidence that services sectors traditionally considered as non-tradable (such as catering and hospitality) expanded more in urban areas.
The urban bias is driven by large firms
Second, the urban bias in structural change can be accounted for by the behaviour of large firms. Among these firms we see a sharp expansion of the services share in big cities between 1995 and 2018. Among small firms we see no such urban bias.
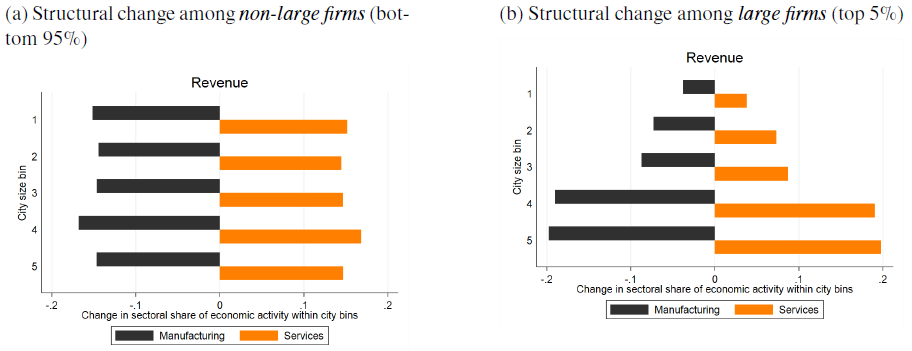
Figure 3 illustrates that the urban bias in structural change is related to large firms. The orange bars show the percentage point increase in the services share of the economy, and the black bars show the corresponding decrease in the manufacturing share. This is shown for quintiles of French cities, where quintile 1 represents the smallest French cities and quintile 5 represents the largest cities. Panel (a) shows that for the smallest French firms (those in the bottom 95% of the sales distribution), the expansion of the services share and the contraction of the manufacturing share have been even across small and large cities. However, panel (b) shows a clear urban bias for large firms (those in the top 5% of the sales distribution). The expansion of the services share is strongest in the largest French cities and weakest in the smallest cities.

Notes: In Figure 3, city size bin 1 (quintile 1) represents the smallest cities and bin 5 the largest cities. Large firms are defined as those in the top 5% of the sales distribution (adjusted to 1995 prices). In panel (a), bars show the percentage point change in sectoral revenue shares within city bins for manufacturing and services between 1995 and 2018 among non-large firms only. Panel (b) does the same among large firms only. For example, −0.1 means a ten percentage point decline. The changes within city bins add to zero.
Since exporting firms tend to be large, urban-biased structural change also extends to exporting behaviour. This means that the largest cities have experienced the strongest shift in exporting shares from manufacturing to services. Manufacturing exports have become more concentrated in small cities, while the opposite is true for services exports.
Large services firms sort into big cities, but large manufacturing firms do not
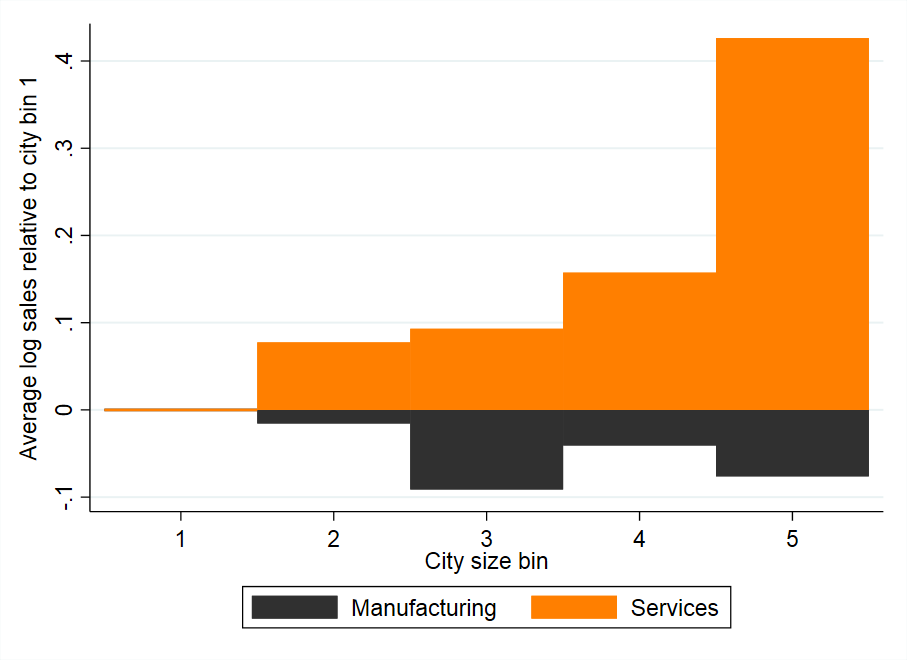
Third, large services firms sort into big cities but large manufacturing firms do not. Comparing services firms in the biggest cities such as Paris and Lyon, where one-fifth of the French workforce is located, to those in the smallest cities that also house one-fifth of the French workforce, we find that the average services firm in the biggest cities is approximately 40% larger than its counterpart in the smallest cities. By contrast, the size of manufacturing firms is more evenly spread out across cities, with a slightly negative correlation between firm size and city size. Figure 4 illustrates this pattern.

Notes: In Figure 4, the relationship between firm size (measured as log sales) and city size bins is shown for each sector. Data for 1995 and 2018 is pooled; sales in 2018 are adjusted to 1995 prices. Bars show the average log sales across firms for manufacturing (black) and services (orange) in each city size bin, normalized to zero for city size bin 1. City size bin 1 represents the smallest cities and bin 5 the largest cities.
Urban-biased structural change in spatial equilibrium
To understand the driving forces behind urban-biased structural change, we develop a quantitative spatial general equilibrium model of city formation whose ingredients are motivated by the patterns we see in the detailed French micro data.
The model rationalises the sorting of firms by allowing for heterogeneous agglomeration effects across firms and sectors. When efficient firms benefit more from locating in big cities, the model predicts positive sorting by firm size and city size – consistent with what we see for French services firms. Conversely, when efficient firms benefit less from locating in big cities, the model predicts negative sorting – consistent with the patterns we see for French manufacturing firms. Large firms in such a sector suffer disproportionately from the congestion costs associated with big cities.
In addition, we allow services production to be labour intensive and manufacturing to be land intensive. Big cities thus put pressure on manufacturing firms in two ways: congestion effects give them an incentive to locate in smaller cities where they can be more productive, and higher land prices disproportionately affect their costs, providing further incentive to settle in smaller, less densely populated locations.
What are the driving forces behind urban-biased structural change?
Based on the French micro data, we calibrate and structurally estimate the model’s key parameters. We then use the estimated model to assess the contributions of sectoral productivity growth, changing agglomeration effects and falling international trade costs to urban-biased structural change.
First, we confirm the role of strong manufacturing productivity growth as a leading driving force of structural change on aggregate, but find that it does not explain the urban bias.
Second, our estimates show that agglomeration externalities have changed in opposite directions across sectors over time, becoming stronger for services and weaker for manufacturing. This result is consistent with evidence based on US and European data of greater spatial concentration in services but de-concentration in manufacturing (Desmet and Henderson 2015). It is also consistent with local knowledge spillovers being more important for young industries, such as innovative services, than for mature industries (Duranton and Puga 2001, Desmet and Rossi-Hansberg 2009). We find that this divergence in agglomeration externalities is a major contributor to urban-biased structural change.
Third, rapidly declining international trade costs for services have further reinforced urban-biased services growth.
Productivity gains can be erased by rising land price
Our model suggests that the urban-biased services growth generated substantial productivity gains in the largest French cities. However, much of those gains were erased by an accompanying rise in land prices. Policies that increase land supply thus have the potential to help large cities reap the productivity gains from structural change.
Conclusions
Between 1995 2018, the French economy experienced a shift from manufacturing to services on aggregate. This was not a uniform change across all regions: it was concentrated in the largest cities with the highest density of economic activity. In those cities, the services sector became more than five times as prominent as manufacturing in terms of revenue, value added, and employment.
This urban-biased pattern of structural change was driven by the behaviour of large firms, with large services firms expanding in urban areas and large manufacturing firms expanding in other parts of the country. The expansion of large services firms in large cities was accompanied by a rapid increase in services exports.
Our results demonstrate the importance of accounting for firm heterogeneity when studying how structural change differentially impacts urban and rural areas. We hope this research helps to explain the evolution of spatial inequalities within countries.
References
Alessandria, G, R Johnson and K Yi (2021), Perspectives on Trade and Structural Transformation, Oxford Development Studies, forthcoming.
Chen, N, D Novy, C Perroni and H Wong (2023), “Urban-Biased Structural Change”, CAGE Working Paper 694.
Desmet, K and J Henderson (2015), “The Geography of Development Within Countries”, Handbook of Regional and Urban Economics, vol. 5, 1457–517.
Desmet, K and E Rossi-Hansberg (2009), “Spatial Growth and Industry Age”, Journal of Economic Theory 144(6): 2477–502.
Duranton, G and D Puga (2001), “Nursery Cities: Urban Diversity, Process Innovation, and the Life Cycle of Products”, American Economic Review 91(5): 1454–77.
Fajgelbaum, P and S Redding (2022), “Trade, Structural Transformation and Development: Evidence from Argentina 1869–1914”, Journal of Political Economy 130(5): 1249–318.
Hanson, G, D Autor and D Dorn (2016), “The China Shock: Learning from Labor Market Adjustment to Large Changes in Trade”, CEPR Discussion Paper 11054.
Herrendorf, B, A Valentinyi and G Duernecker (2018), “Structural Change and the Productivity Slowdown”, VoxEU.org, 16 March 2018.
Matsuyama, K (2009), “Structural Change in an Interdependent World: A Global View of Manufacturing Decline”, Journal of the European Economic Association 7(2/3): 478–86.
