
Actin dynamics in microtubule mutants
Supervisor: Dr Anne Straube (CMCB, WMS)
The main components of the cytoskeleton are made of tubulin and actin, which polymerise into actin filaments and microtubules respectively. The cytoskeleton allows cells to divide, transport matter around the cell, organisation and to be mobile, see figure 1.
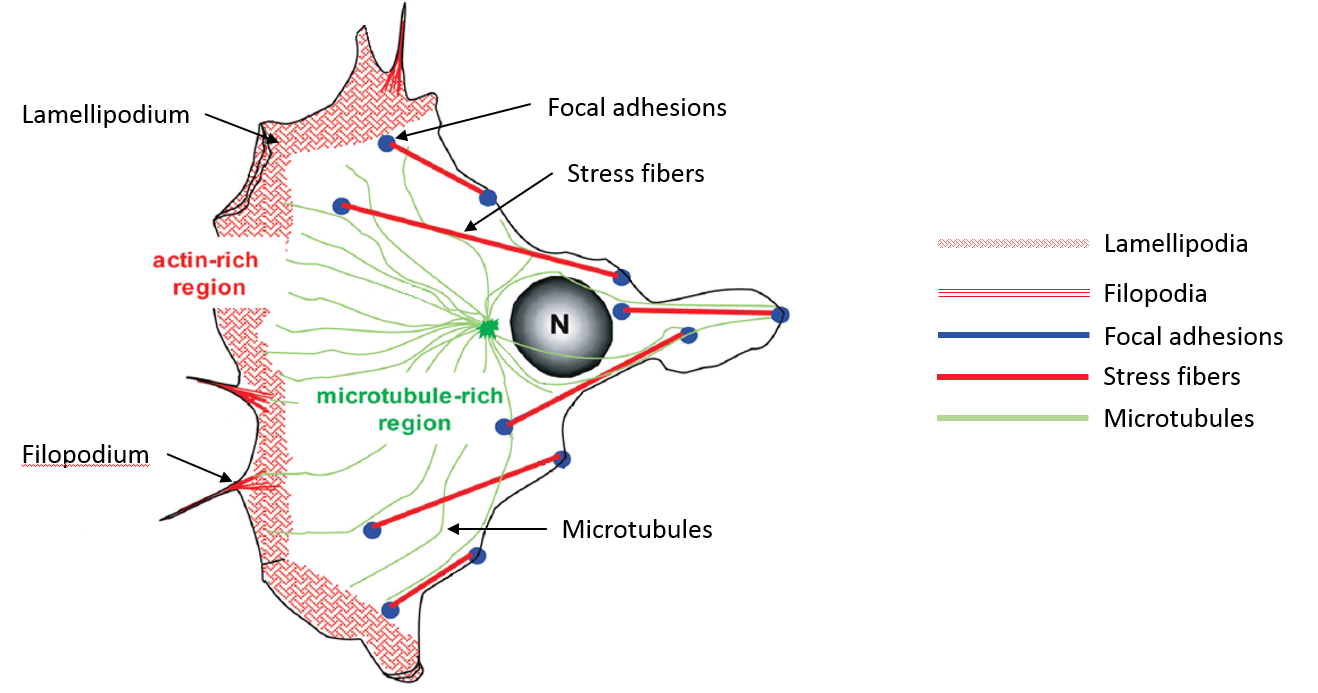
Figure 1: A typical Eukaryotic cell displaying actin rich regions and microtubule rich regions.
Figure adapted from S. Manneville, “Actin and Microtubules in Cell Motility: Which One is in Control?”, Traffic, 2004, 5: 470 – 477.
Furthermore, the is cross talk between actin and microtubules, they co-operate to achieve the function of the cytoskeleton. This is where my mini-project comes in if we disrupt the microtubules in a cell, how will it affect actin dynamics of that cell? End binding proteins are highly conserved components of microtubule plus end protein networks. By transfecting cells with siRNA, we can reduce the expression of different end binding proteins.
By observing protrusions of a cell, we can measure the protrusion velocity and determine the velocity distribution for cells which have been transfected with different siRNAs. To observe a protrusion, GFP labelled actin cells are used, and a region is photobleached, see movie and figure 2.
Movie: An example of a protrusion. The region of interest (white line) is used to construct a kymograph (figure 2, left).
A region of interest is drawn along the protrusion. At each time point, the pixels along the line are recorded. Stacking these lines of pixels results in a space-time plot of pixel intensities, called a kymograph. Since a kymograph is a space time plot, its gradient is velocity.
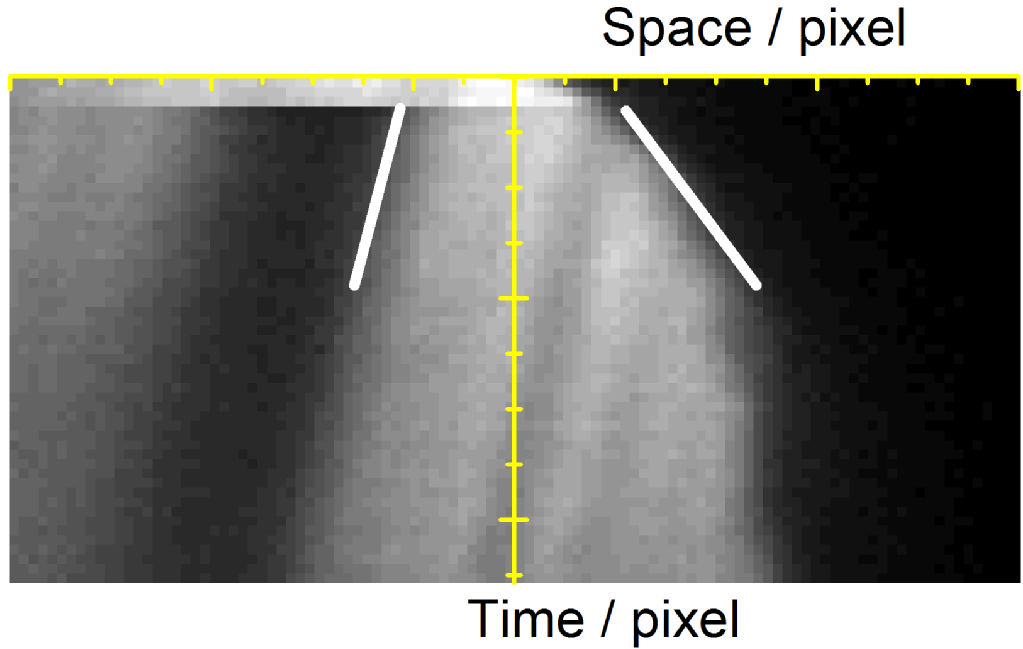
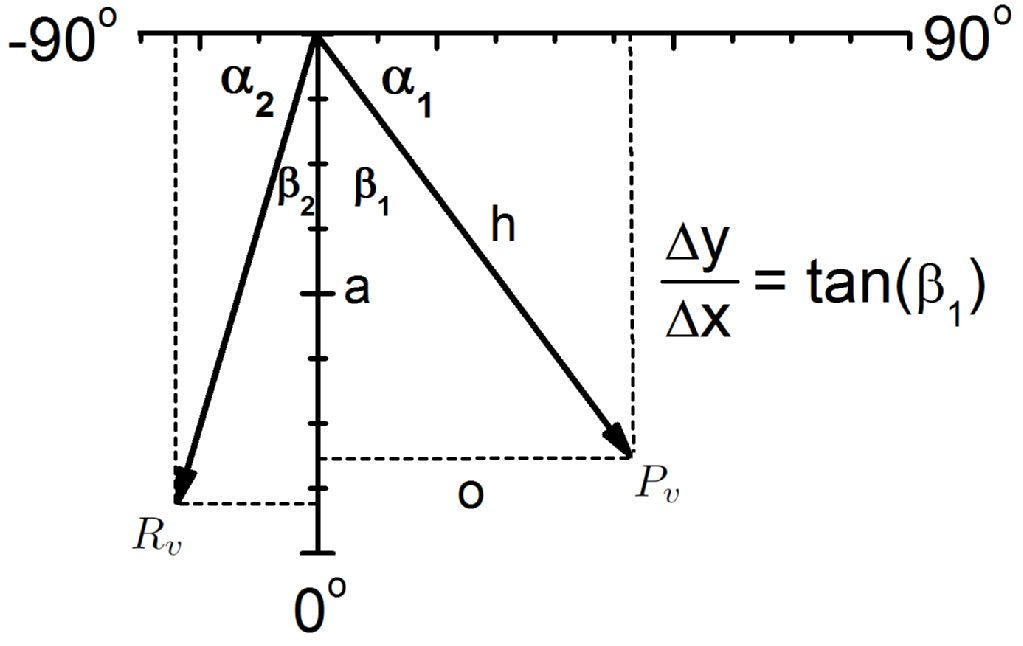
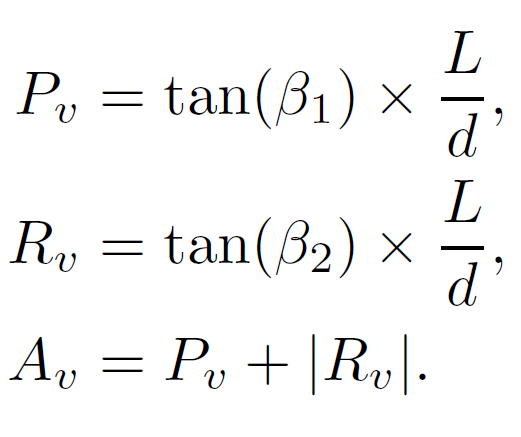
Figure 2: (left) A kymograph of the protrusion shown in the movie. Two white lines are shown, which resemble the gradients measured to calculate velocities. (middle) A vector diagram showing how the components are calculated. ImageJ was used to calculate the angles alpha1 and alpha2, which in turn are used to calculate beta1 and beta2. (right) From the two calculated angles, the equations shown calculate the protrusion velocity (Pv), retrograde flow velocity (Rv) and actin polymerisation speed (Av). Here, L and d are the pixel dimensions, which are required to convert to units of length and time.
If we measure these velocities for many cells, we can determine the distribution of velocities for each transfected group to see if there are statistically significant differences.