Feedback for the Network Day as a Whole
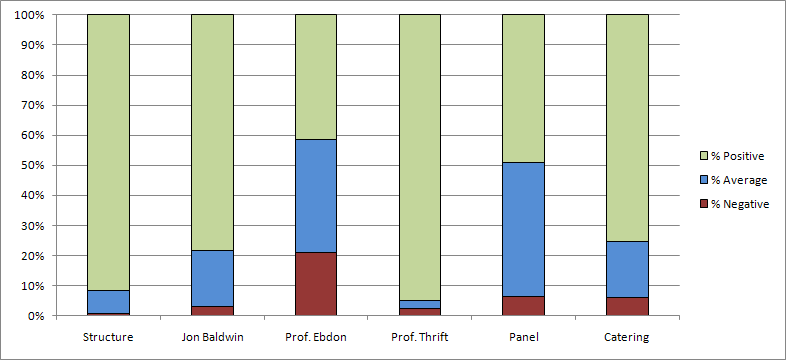
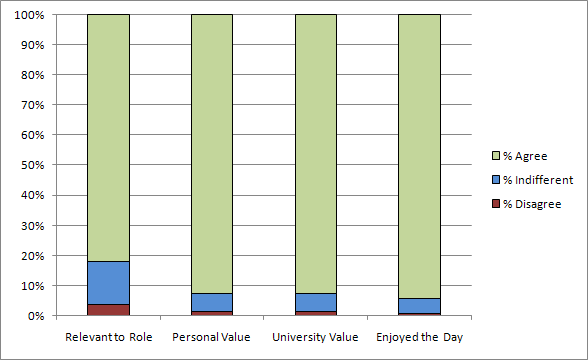
Here are the overall results for the day, taking into account all 139 forms that we received, both as paper copies and online.
- % Positive/% Agree refers to the percentage of people who responded "Good" or "Very Good", "Agree" or "Strongly Agree" for each question.
- % Negative/% Disagree refers to the percentage of people who responded "Poor" or "Very Poor", "Disagree" or "Stronly Disagree" for each question.
- % Average/% Indifferent refers to the percentage of people who responded "Average" or "Neither Agree nor Disagree" for each question.
- n/a refers to people who did not answer the particular question, wrote "n/a" on the sheet, or made the response unclear in some other way (for instance ticking more than one box for the same question on the paper copy). These are left out when calculating the % Positive, % Negative and % Average.
| n/a | Very poor | Poor | Average | Good | Excellent | % Positive | % Negative | % Average | ||
| Structure | 4 | 1 | 0 | 10 | 97 | 27 | 92% | 1% | 7% | |
| Jon Baldwin | 9 | 2 | 2 | 24 | 85 | 17 | 78% | 3% | 18% | |
| Prof. Ebdon | 6 | 5 | 23 | 50 | 46 | 9 | 41% | 21% | 38% | |
| Prof. Thrift | 3 | 2 | 1 | 4 | 66 | 63 | 95% | 2% | 3% | |
| Panel | 27 | 3 | 4 | 50 | 43 | 12 | 49% | 6% | 45% | |
| Catering | 2 | 2 | 6 | 26 | 62 | 41 | 75% | 6% | 19% |
| n/a | Strongly Disagree | Disagree | Neither Agree nor Disagree | Agree | Strongly Agree | % Agree | % Disagree | % Indifferent | ||
| Relevant to Role | 0 | 1 | 4 | 20 | 83 | 31 | 82% | 4% | 14% | |
| Personal Value | 1 | 1 | 1 | 8 | 83 | 45 | 93% | 1% | 6% | |
| University Value | 0 | 1 | 1 | 8 | 83 | 46 | 93% | 1% | 6% | |
| Enjoyed the Day | 1 | 1 | 0 | 7 | 83 | 47 | 94% | 1% | 5% |


