
Making Lines appear in front of points in Excel
I found myself wanting to produce an x-y plot where some of the sets of data were points, and some were lines, and I wanted to have the lines in front of the points. Normally the way to put some data in front of others the order of data sources should be changed using the select data source dialog. However, whatever order I used, the lines were behind the points, ie like the graph on the left rather than the graph on the right:

Not what is wanted: Lines underneath
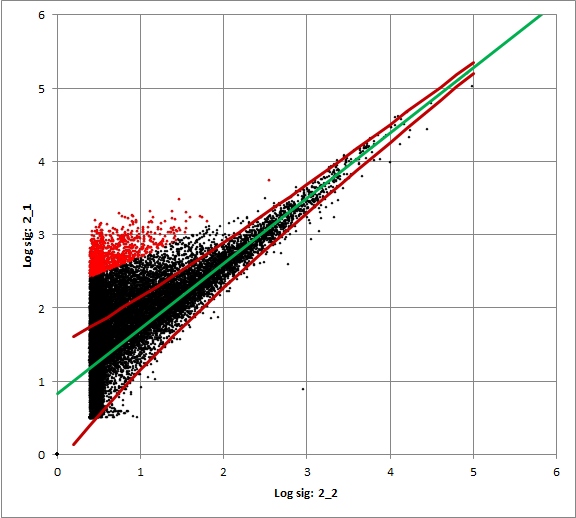
This is what is wanted: Lines on top
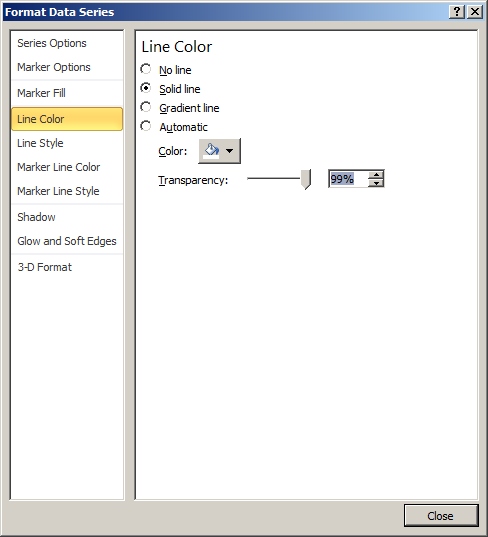
The trick turns out to be to slightly change the format for the dataseries associated with the points that should be behind the lines (In this case the black points). Originally there was no line associated with the points. This should be changed to a very faint white line (99% transparency lines).
Once this is done, the dataseries ordering works and it is possible to put the lines in front of the points by putting its data series at the end.
This was originally found to work with Excel 2010, but also works with Excel 2013 and 2016, although the dialog boxes used to set the point and line formats have changed.