
My Research
My Publications: Duckenfield, T., Anfinogentov, S.A., Pascoe, D.J., Nakariakov, V.M., Detection of the second harmonic of decay-less kink oscillations in the solar corona, Astrophys. J. Lett. 854, L5, 2018, DOI: 10.3847/2041-8213/aaaaeb
Duckenfield, T., C. R. Goddard, D. J. Pascoe, V. M. Nakariakov, Observational signatures of the third harmonic in a decaying kink oscillation of a coronal loop, A&A.632 (2019) A64, DOI: 10.1051/0004-6361/201936822
Timothy Duckenfield, Anne-Marie Broomhall, Flares on the Sun and on other stars, Astronomy & Geophysics, Volume 60, Issue 6, December 2019, Pages 6.29–6.33, https://doi.org/10.1093/astrogeo/atz193
Description: My research1 currently focuses on "decay-less" kink oscillations ocurring in coronal plasma non-uniformities such as coronal loops. These are ubiquitous in the corona2, opening up excellent perspectives for routine plasma diagnostics. By using MHD seismology estimates of the local magnetic field strength, density stratification scale height and Alfén speeds can be made.
One such seismological technique is to compare period ratios from different harmonics/overtones, and attributing any differences from the expected integer ratio to local variations in plasma density/magnetic field3. I reported the first detection of multiple harmonics of decay-less kink oscillations here, so this method could be used whenever we see a kink oscillation in the corona i.e. everywhere. An example application is given below.
To analyse these low amplitude oscillations I predominantly use EUV images from the Solar Dynamics Observatory, specifically its Atmospheric Imaging Assembly (SDO/AIA) retrieved using JSOC, though you can quickly scan equivalent data with Helioviewer. Because some decay-less oscillations amplitudes are too small to resolve (≤ AIA pixel size, 0.7”) I use additional processing and statistical techniques, such as Multi-Gaussian Normalisation4 and Motion Magnification5. You may find more information on the latter on this page.
Example application:
![An example coronal loop, observed in extreme ultraviolet 17.1 nm with SDO/AIA, 21/01/2013. Slits used for time-distance plots & Fourier analysis [below] are shown.](loop.png)
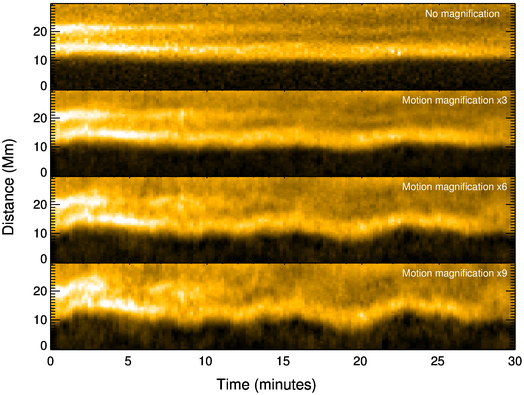
As an example, consider the coronal loop depicted above, with a length of ~292 Mm (15 Earths could fit inside that arch side by side!). Slits for time-distance analysis are shown, where the axis of the loop is tracked over time. To amplify the low amplitude oscillations motion magnification is applied [below for slit 63]. The original plot (top) is difficult to analyse, but the magnified time-distance plots clearly show the loop is oscillating transversely i.e. the so-called "decay-less" kink mode.
Taking the Fourier spectrum for each slit's waveform we can build a picture of how spectral power is distributed throughout the loop. The two-dimensional distribution of Fourier spectral power [below] shows three regions of spectral power; a longer period at ~slit 63 (apex), and a shorter period at slits either side (legs). This is evidence of the presence of the fundamental and second harmonic.
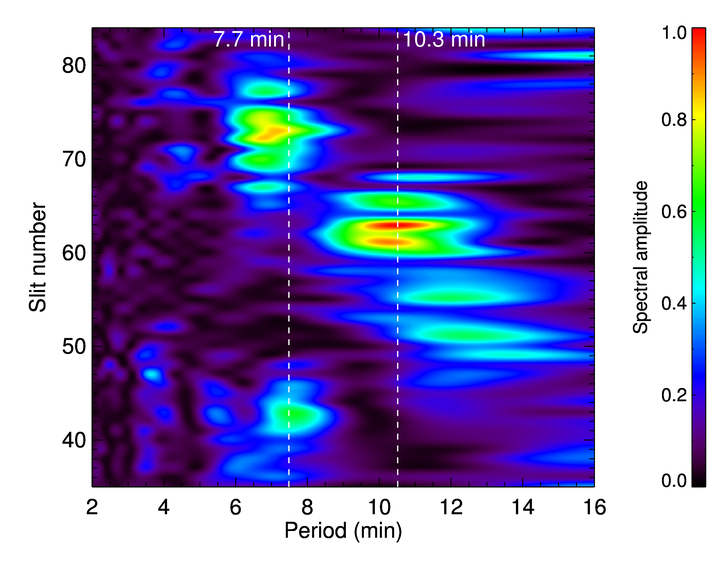
In this case the fundamental-to-second-harmonic period ratio is P1 /2P2 =10.3/(2 × 7.7) ≈ 0.69 instead of the expected value 1. If we attribute this difference purely to density stratification of scale height H:
Which agrees with other estimates of density scale height. Differences to the period ratio may be caused by other effects as well - magnetic field strength, siphon flows, coronal rain to mention a few, but the usefulness of this method is clear. For more details, or questions/suggestions, read my letter or pop me an email.
I am always looking for collaborators so if you are interested in my coronal seismology work, or indeed you just have any wave/transverse motion you are looking into which perhaps some techniques shown here may be useful for, please get in touch.
Further reading/references:
- ResearchGate profile here.
- Anfinogentov, S. A., Nakariakov, V. M., & Nisticò, G. 2015, A&A, 583, A136
- Andries, J., Van Doorsselaere, T., Roberts, B. et al. Space Sci Rev (2009) 149: 3.
- Morgan, H. & Druckmüller, M. Sol Phys (2014) 289: 2945.
- Anfinogentov, S., & Nakariakov, V. M. 2016, SoPh, 291, 3251
To help visualise the waves I am studying, my colleague Erwin Verwichte has kindly developed a really useful visualisation tool that can be found here. I focus on the kink (m=1) modes, for example the 2nd harmonic seen here. For other visualisation tools, see Erwin's Warwick Plasma Calculator.