User Guide
Description of Applet
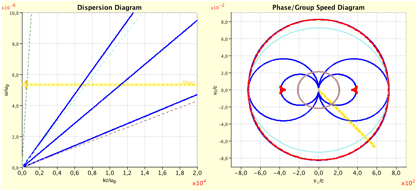
The plasma waves analyser applet calculates and visualises the spectrum, phase and group speed diagrams of plasma waves in a uniform, static plasma environment in the presence of a uni-directional constant magnetic. The tool takes into account the role of plasma pressure. The spectrum calculation is based on a linear two-fluid model and as such it does not include kinetic effects such as e.g. Landau damping.
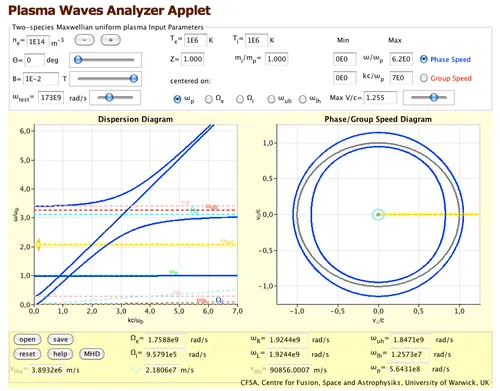
The applet has three different areas that will be described in detail: the input area at the top, the visualisation area in the middle and the output area at the bottom.
Input Area
The equilibrium plasma state can be set here, as well as the scales of the plots.
The electron density, electron and ion temperatures can be set as well as the ion species (charge in multiples of e, Z, and mass in multiples of proton mass). The external magnetic field can be set, either numerically or by adjusing a slider.
For the plasma wave, the propagation angle theta can be set. Alternatively, you can also drag with the mouse the dotted yellow line in the phase/group speed diagram.
The magnetic field can be adjusted with the text field or the slider in the input area.
Similar to the propagation angle the test frequency can not only be adjusted with the text field or slider in the input area, but also in the spectrum (dispersion diagram) by dragging the dotted yellow line up or down with the mouse. Once the dragging is finished and the line is released, a number of different phase/group speed diagrams corresponding to different testfrequencies will be calculated. But be aware this may take a little moment so that the plot on the right does not change instantaneously.
For quick access to critical regimes in frequency, radio buttons are provided that allows the user to display the spectrum at the key plasma, ion and electron gyro- and hybrid frequencies.
The Phase and Group Speed radio buttons toggle the blue Phase speed curve and the red Group speed curve between visible and invisible.
Finally the maximum speed shown in the Phase/Group Speed Diagram allows to magnify the middle area of this diagram.
Diagram Area
In the dispersion diagram the testfrequency can be adjusted by dragging the dotted yellow line.
The Phase Group/Speed diagram’s yellow line allows adjusting the propagation angle.
Output Area
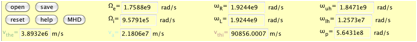
The Output area at the bottom does not only show output parameters (of which the velocity are colour coded for better mapping with the Phase/Group Speed Diagram, but also has a few control buttons:
- The Open button allows to load previously saved applet states.
- The Save button allows to save to current applet state.
- Reset does reload the configuration the applet has started in the first place.
- Help does show some help.
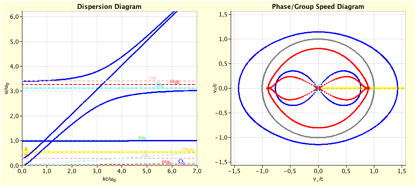
- The MHD button adjusts the input parameters to the following alternative predefined setting.