
TCAT - Data sets for IM904
TCAT
How do we use data from Twitter? At CIM we use the Twitter Capture and Analysis Tool (TCAT). We have servers running TCAT. You can log into these servers by going to a webpage. There are lots of different options on the web page. The below video shows you some ways you can use TCAT.
The TCAT tool is developed by the Digital Media Initiative. A wiki for the project is here and a slightly more technical FAQ is here. Borra and Reider (2014) introducted the tool in their paper available here. An example project using this tool is Marres and Moats (2015) available here.
Accessing TCAT at CIM
There are two servers running TCAT at CIM and the data sets for IM904 are on both.
To access TCAT click on either of the links below. Your web browser will go to the server and you will be asked to log in. Enter the username and password for that server.
| Link | Username | Password |
|---|---|---|
| http://janeway.cim.warwick.ac.uk | tcat | uTsuNbHc3EC68MFqG9PeDko5npy6FqGFbmjpY |
Data sets for IM904
There are multiple data sets for IM904 on these servers.
Query based
The tweets in the query based data sets were collected based on words in the tweets. Twitter sent tweets to us which contained specific words. One data set is uses words associated with Brexit related words and the other uses words related to Driverless cars.
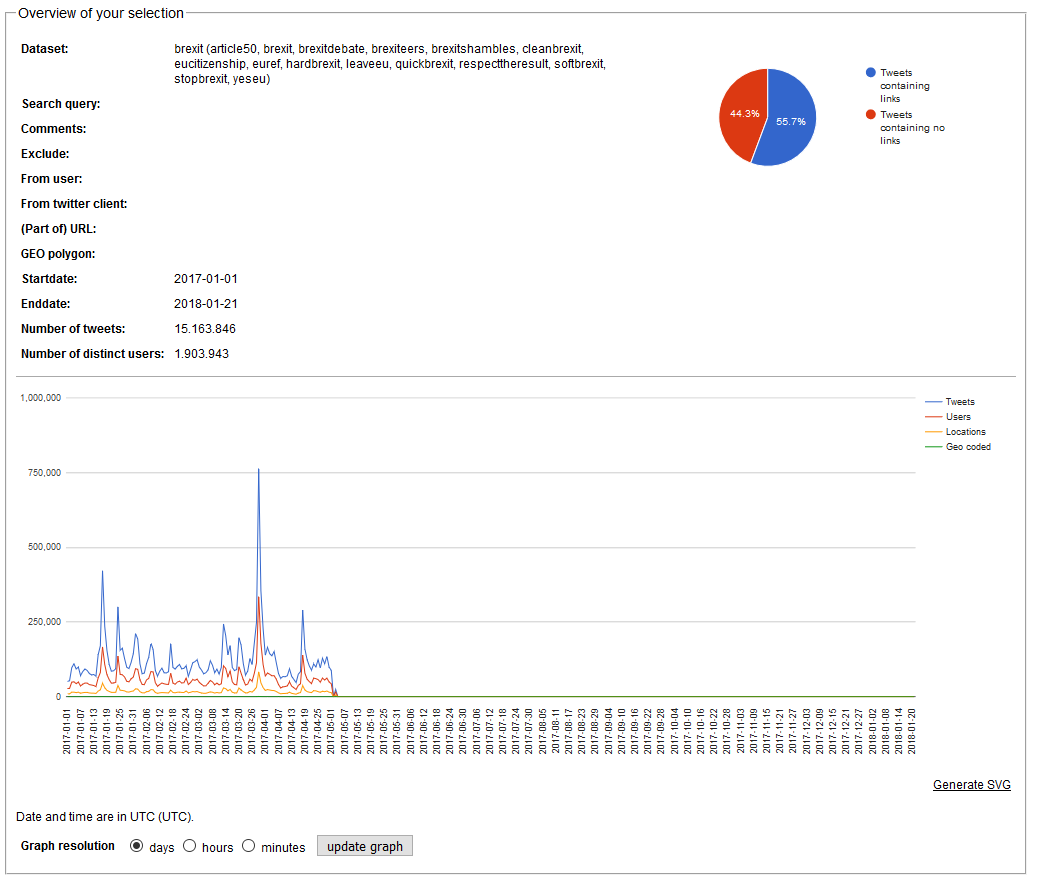
Brexit
This data set is on the picard server (see the login details above). Details of the Brexit data sets are below.
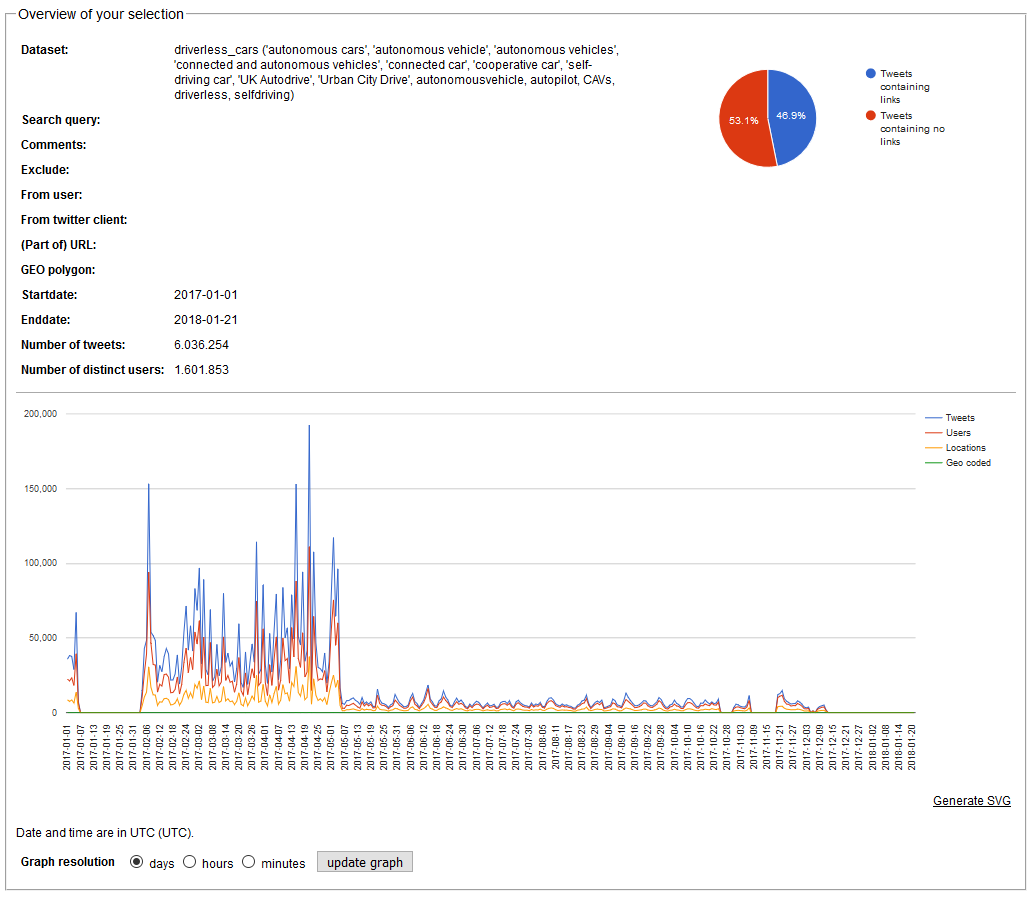
Driverless cars
This data set is on the janeway server (see the login details above). Details of the Driverless cars data set are below.
Location based
The tweets in each data set were collected from Twitter based on location. We connected to Twitter using a stream API and in that request we specified an area using geo-cordinates. From that point onwards Twitter sent us Tweets from this area.
There are a few important points about these data sets:
- Some tweets have the longitude and latitude location from where the user sent tweet. Others are from people who set a place in the area as their location.
- You can filter the data by location. To do this you enter a set of co-ordinates into the 'GEO bounding polygon' field. The co-ordinates for each area is given below. You can copy the co-ordinates directly into the TCAT.
- To access the data you will need to filter by date. The dates shown in the drop down box are incorrect. The reason these are incorrect is that the data was collected by another server and imported to TCAT.
Information about the data sets is below.
London
The name of the data set is LondonArea
There total number of tweets is 15, 879, 050
Date collection started on 2017-01-01
Date collection ended on 2018-01-01
The geobounding box for this area is -0.427686 51.707886, 0.243784 51.707886, 0.243784 51.321431, -0.427686 51.321431, -0.427686 51.707886
The figure below shows how much data was collected day by day over the collection period. There were period where the crawler did no function correctly or Twitter stopped collection for a short while.

Coventry
The name of the data set is CoventryArea
There total number of tweets is 1, 607, 630
Date collection started on 2017-03-19
Date collection ended on 2018-01-01
The geobounding box for this area is -1.631402 52.345261, -1.631768 52.48189, -1.388598 52.482132, -1.388232 52.345503, -1.631402 52.345261
The figure below shows how much data was collected day by day over the collection period. There were period where the crawler did no function correctly or Twitter stopped collection for a short while.

Birmingham
The name of the data set is BirminghamArea
There total number of tweets is 2639887
Date collection started on 2017-04-06
Date collection ended on 2017-12-22
The geobounding box for this area is -2.107731 52.605246, -1.68957 52.605246, -1.68957 52.36161, -2.107731 52.36161, -2.107731 52.605246
The figure below shows how much data was collected day by day over the collection period. There were period where the crawler did no function correctly or Twitter stopped collection for a short while.
