Surrogate test
Contents
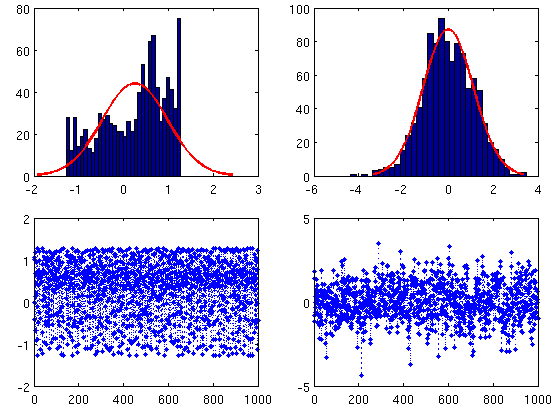
Plotting linear and nolinear process with gaussian fit
Nonlinear process: Hennon map
Xnl = generate_henon (1000);
h(1)=axes('Position',[.06 .08 .4 .4]);
plot(Xnl,':.'),axis([0 1000 -2 2])
h(2)=axes('Position',[.06 .58 .4 .4]);
histfit(Xnl)
% Linear Process: linear ARMA AR(3)
Xlin = generate_ar_signal ([.5 -.3 .3], 1000);
h(3)=axes('Position',[.56 .08 .4 .4]);
plot(Xlin,':.'),axis([0 1000 -5 5])
h(4)=axes('Position',[0.56 0.58 .4 .4]);
histfit(Xlin)
set(h,'Visible','on');
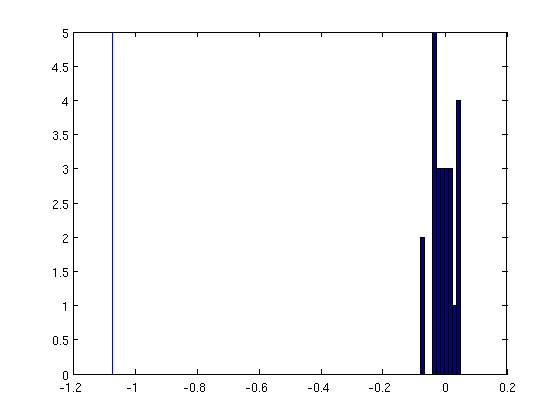
testing the Null hypothesis
The line does not lie within the null distribution
Xnl = generate_henon (1000);
Tnl = comp_rev (Xnl);
n_surr = 24;		% Number of surrogates
Tnls = zeros(n_surr,1);
for n=1:n_surr, Xs = generate_iAAFT(Xnl);Tnls(n) = comp_rev(Xs);end
figure,hist(Tnls),A=axis;line([Tnl Tnl], A(3:4));
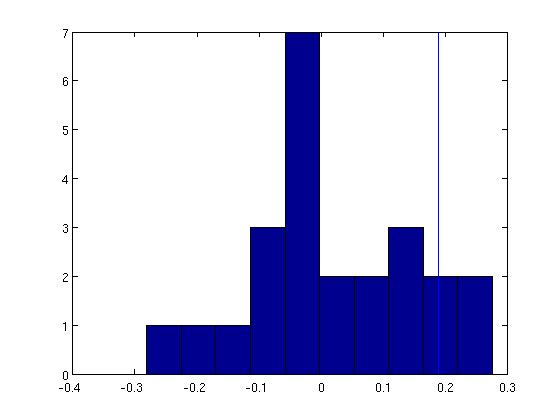
The line does lie within the null distribution
Xlin = generate_ar_signal ([.5 -.3 .3], 1000);
Tlin = comp_rev (Xlin);
n_surr = 24;		% Number of surrogates
Tlins = zeros(n_surr,1);
for n=1:n_surr, Xs = generate_iAAFT(Xlin);Tlins(n) = comp_rev(Xs);end
figure,hist(Tlins),A=axis;line([Tlin Tlin], A(3:4));