
Best practice: Creating inclusive mathematical content
This guidance summarises a presentation given by Dr Martyn Parker from the Statistics department at the University of Warwick.
Karshmer and Bledsoe (2002) comment that reading and writing mathematics is fundamentally different to reading and writing normal text. As such this guidance is specific to mathematical content and should not be used for other types of text-based content. Sorge et al. (2014) add that:
- Mathematical notation uses a much wider range of symbols than ordinary text and therefore needs translating.
- Formulas often exhibit a two dimensional layout that has to be conveyed to a reader, either by changes in intonation or by making explicit announcements.
- Formulas can be nested arbitrarily deep, adding the need to communicate that complexity.
There are three methods that can be used to accurately translate mathematical content (Word, HTML and EPub3). For the purposes of this guide we will only be considering Word and HTML.
Word
You should always use the equation editor in Word to create mathematical content even for just a single letter. This is available on the Insert tab at the far right of the ribbon. It is the button with the Pi symbol on it with Equation written next to it.

Do not use the insert Symbol button which is located below the Equation button as this will cause errors in the translation of your mathematical content. Do not use the Superscript or Subscript buttons and do not add your equation as an image. You are just going to need to provide the same information in the alt text tag as you would if you used the equation editor, so you won't gain anything from this.
Microsoft Word has a built in accessibility checker that you can use to check how accessible your document is before you use it. Whilst this should not be solely relied upon, it does check the most basic accessibility components. To access it, click on the Review tab and then click on the Check Accessibility button on the ribbon.
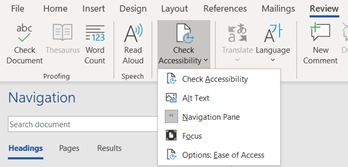
Please be aware that particularly in relation to mathematical content, it is possible to achieve a positive accessibility check even though the mathematical content does not make sense. An additional check is to use the Read Aloud button on the Review tab so that you can hear how screen reader software will interpret your content.
Please note that the Word good practice guidelines for other types of text-based content are still valid.
- Use the equation editor to compose the correct equation.
- Open the Find and Replace panel.
- Copy the symbol or text you wish to replace and paste into the Find box.
- Write ^c in the Replace box. (Shift + 6 and then lower case c)
- Copy the correct equation created in step 1.
- Press Replace All.
HTML
Accessibility Insights for Web is an extension for Google Chrome and Microsoft Edge browsers that helps developers find and correct accessibility issues on websites and HTML pages.
Moodle uses MathJax to render equations using its Equation editor or LaTeX. So for equations it is a really useful tool which works with most browsers. You can right click on your equations to check them and it works with any Accessible Rich Internet Application (ARIA) aware screen reader.
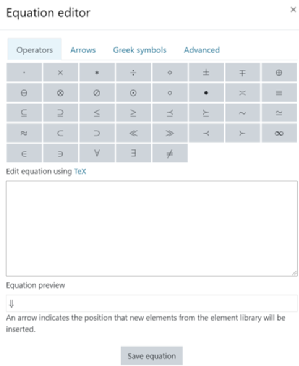
To add an equation in Moodle, turn editing on and then open the settings menu for the relevant activity or resource. The Equation editor is at the far right of the toolbar. Ensure you click on the correct button (it looks like a calculator) as it is really easy to click the Insert table button by mistake. Remember although they are readily available on the toolbar, do not use the Subscript or Superscript buttons to generate your equation nor the Insert character button.

The dialogue box that appears will then allow you to generate your equation. There are four tabs to choose components from: Operators, Arrows, Greek symbols and Advanced. You can also edit your equation using TeX by clicking on the link above the Equation preview box. Once you are happy with your equation simply click on the Save equation button at the bottom of the dialogue box.
Assistive technologies
Screen readers interpret mathematical content in different ways and can work very differently across operating systems and browser combinations. Be aware that some combinations do not work correctly, some examples include:
- Non-visual desktop access (NVDA) works well with MathPlayer and/or Access8Math extension
- Job Access With Speech (JAWS) works well with ARIA support (but MathJax testing reports it only works with Internet Explorer and Firefox).
- Orca for Ubuntu is listed as working with Firefox on Ubuntu but with Google Chrome it produces errors.
- Dragon does not work well with mathematical content full stop.
- MathPlayer (Windows only) and MathType are often listed as working for Word and PowerPoint.
For further guidance on what browser and operating system combinations work and what do not, please see the website below:
https://docs.mathjax.org/en/v2.7-latest/misc/accessibility-features.html
Diagrams
Mathematical diagrams can be very complicated and are difficult to create in alternative versions. Below is a list of software that can help with this process:
- Desmos can be used for Braille support, audio trace, maths aware voice over and tactile diagrams.
-
R Project for statistical computing provides meaningful engagement with statistics and graphics.
-
BrailleR package’s author provides a supporting online textbook BrailleR in Action which contains useful information on data visualisation for those with visual impairments. The BrailleR package is available from GitHub.
-
For more details regarding Data sonification and Data tactualization, Joo Young has written a blog post covering three available packages tailored for visually impaired R users.
-
R is text-based and the accessibility of R is discussed by the author of the BrailleR package.
- Let’s use R Now (Blind Edition) is an online text written by the author of BrailleR.
- Sonification provide further approaches to alternative representations of graphical data.
Examples of mathematical diagrams
A histogram of 1000 points sampled from the normal distribution, with text description provided after the figure.
$breaks
 [1] -4 -3 -2 -1  0  1  2  3  4  5

$counts
[1]   2  21 120 340 357 143  14   2   1

$density
[1] 0.002 0.021 0.120 0.340 0.357 0.143 0.014 0.002 0.001

$mids
[1] -3.5 -2.5 -1.5 -0.5  0.5  1.5  2.5  3.5  4.5

$xname
[1] "rnorm(1000)"

$equidist
[1] TRUE

attr(,"class")
[1] "histogram"
# The raw input is below
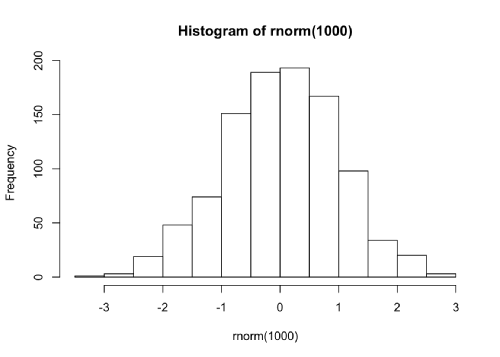
print(hist(rnorm(1000)))A histogram of 1000 points sampled from the normal distribution, with BrailleR’s text description provided after the figure.
This is a histogram, with the title: Histogram of rnorm(1000)
"rnorm(1000)" is marked on the x-axis.
Tick marks for the x-axis are at: -3, -2, -1, 0, 1, 2, and 3
There are a total of 1000 elements for this variable.
Tick marks for the y-axis are at: 0, 50, 100, 150, and 200
It has 13 bins with equal widths, starting at -3.5 and ending at 3 .
The mids and counts for the bins are:
mid = -3.25  count = 2
mid = -2.75  count = 4
mid = -2.25  count = 20
mid = -1.75  count = 37
mid = -1.25  count = 82
mid = -0.75  count = 138
mid = -0.25  count = 191
mid = 0.25  count = 199
mid = 0.75  count = 161
mid = 1.25  count = 88
mid = 1.75  count = 54
mid = 2.25  count = 18
mid = 2.75  count = 6
# The raw input is below
VI(hist(rnorm(1000))) # BrailleR version, including text descriptionA dot plot of Ozone levels against months 5 (May) to 9 (September) in New York, 1973 with BrailleR’s text description provided after the figure.
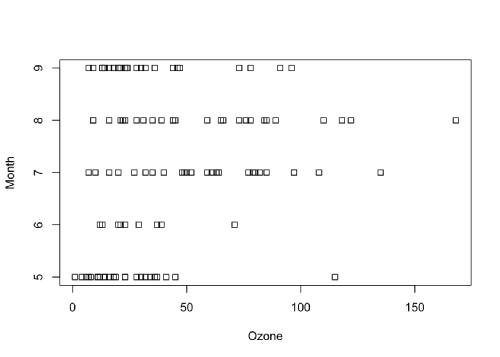
This graph has 5 dotplots printed horizontally
with the title:
"" appears on the x-axis.
"" appears on the y-axis.
Tick marks for the x-axis are at: 0, 50, 100, and 150
the data that range from 1 to 168 has been broken into 6 bins.
The counts are:
5: 18 7 0 0 1 0
6: 5 3 1 0 0 0
7: 5 7 9 4 1 0
8: 7 6 7 3 2 1
9: 19 6 2 2 0 0
# The raw input is below
attach(airquality)
VI(with(airquality, dotplot(Ozone~Month, ylab="Month")))
detach(airquality)A dot plot of Ozone levels against the average wind speed in New York, 1973 with BrailleR’s text description provided after the figure that breaks the graph into a 4x4 grid and gives the data in tabular form.
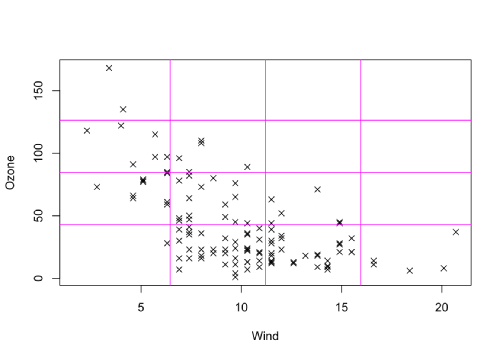
1  2  3 4 Sum
4    2  0  0 0   2
3    7  5  0 0  12
2    9 15  6 0  30
1    1 39 27 5  72
Sum 19 59 33 5 116
# Original input
attach(airquality)
plot(Wind, Ozone, pch = 4)
abline(v=min(Wind)+c(0.25,0.5,0.75)*(max(Wind)-min(Wind)), col=6)
abline(h = min(Ozone, na.rm=TRUE) +c(0.25,0.5,0.75)*(max(Ozone, na.rm=TRUE)-min(Ozone, na.rm=TRUE)), col=6)
WhereXY(Wind, Ozone, grid = c(4,4))
detach(airquality)Here are some examples of data being represented by sounds in the audible range:
A plot of with both text description and audio representation after the figure.
  1  2  3  4 Sum
4    0  0  0 25  25
3    0  0 25  0  25
2    0 25  0  0  25
1   26  0  0  0  26
Sum 26 25 25 25 101Colour
Do not use colour as the only way of conveying meaning. If you want to use colour you should always provide a text alternative for learners with visual impairments. In the first table below, the mandatory module is shown in red and the optional module is shown in green. This is not suitable for learners with red/green colour blindness or for learners who rely on screen readers, as the colours will not be picked up by the software.
| Introduction to grammar |
| Intermediate grammar |
A simple accessible alternative is:
| Introduction to grammar (mandatory) |
| Intermediate grammar (optional) |
Handwriting
Handwriting is not technically accessible. One Note will convert handwriting to text but accuracy can vary. Mathpix can also read handwritten mathematical content and convert it to a variety of accessible formats.
Audio transcription
Please see the general information on the accessibility page for further information about audio transcripts and bear in mind that automatically generated transcripts are rarely accurate!
Mathematical specific examples on audio transcription include:
LaTeX
LaTex is not particularly accessible and whilst there are some workarounds, they require a significant amount of knowledge and effort to make them usable. Here is some further information about LaTeX and accessibility:
- Blog on LaTeX and PDF accessibility
- TeX user group information on PDF accessibility and PDF standards
- Discussion on Stack Exchange regarding LaTeX and PDF accessibility
PDF documents
We do not recommend converting documents that contain mathematical content (e.g., equations) into PDFs. PDF software does not translate or render mathematical equations effectively and the gobbledegook that is produced will be incomprehensible to anyone using a screen reader.
References
Karshmer, A.I. and Bledsoe, C. (2002) 'Access to Mathematics by Blind Students', International Conference on Computers for Handicapped Persons.
Sorge, V., Chen, C., Raman, T.V. and Tseng, D. (2014) 'Towards making mathematics a first class citizen in general screen readers', Proceedings of the 11th Web for All Conference, 40, pp. 1-10.
Useful resources
Good Practice on Inclusive Curricula in the Mathematical Sciences
Centre for Excellence in Teaching and Learning and the Mathematical Science and Operational Research network inclusive design for mathematics learning: Using Word to write an accessible mathematics document
The Sigma Network for excellence in mathematics and statistics support: Getting started with effective entry of equations in Word
DIAGRAM Center provide guidance and example alternative text descriptions for simple and more complex images.
The UK Association for Accessible Formats provides further standards and guides.
Finite-state Machines provide suggestions for creating alternative descriptions and representations for diagrams.
How to describe images provides a wide range of different examples and guidelines on descriptive text.
MathTrax sonification package produced by NASA.
Some research into Sonification of depictions of numerical data.
Data sonification for R is available as the R package, Sonify
The tactileR R package any graphics object can be converted into tactile graphics with BrailleR containing numerous other accessibility features including tactile graphics creation.