
Welcome to the WJETT blog
What is WJETT?
The WJETT blog or Warwick Journal of Education - Transforming Teaching blog is designed to encourage staff and students to disseminate good practice and to engage with their peers on academic cultural critique or areas of research that they find interesting. With the increased focus on ‘teachers as researchers’ in the sector, many qualified teachers are expected to publish the outcomes of any action research projects they undertake. The WJETT blog can be the first step on your journey towards publishing and enables you to experience publishing and reviewing in a friendly and supportive environment.
You will need to scroll down the page below the tags to see the posts.
The demographics of the PGCE applicants
It is an ongoing challenge for the Initial Teacher Education (ITE) sector to produce robust application and recruitment three-year trend data, due to the recent in-year changes to allocations of ITE places and the impact this can have on an ITE provider’s autonomy and flexibility to recruit to good size groups of phase and subject specialisms.
The following summarises the Centre for Teacher Education (CTE) recent analysis highlighting the changing levels of applications and accepted offers for the admissions cycles 2015-16 to the current 2018-19.
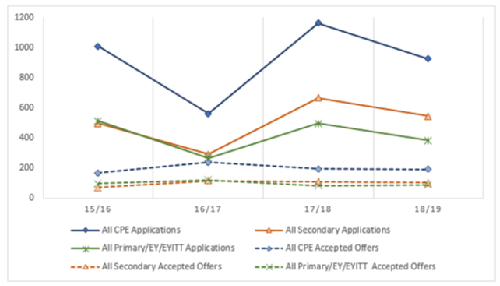
Figure 1.1: Applications and accepted offers from 15/16 to 18/19 cycle
Interestingly, the years where applications were lowest (16/17 and 18/19) show slightly higher rates of accepted offers (18/19 represents the picture as of March 2018).
On the whole, trends are similar across phases, although Primary applications appear to have suffered more over the last two years than Secondary. This however, has had little effect on the conversion to their respective accepted offers.
For applications, Warwick is largely on par with the sector, taking between a 20%-30% drop on last year. However, a larger proportion of our applicants are accepting our places than across the sector, especially in the Primary phase.
It is interesting to consider whether, when applications are down, but accepted offers are up in-year, are we attracting higher calibre applicants or are we offering places to a wider group? This question can only be explored by an over-time analysis to include in-year retention data as understanding how many students stay the course and are recommended for Qualified Teacher Status (QTS) is a key factor.
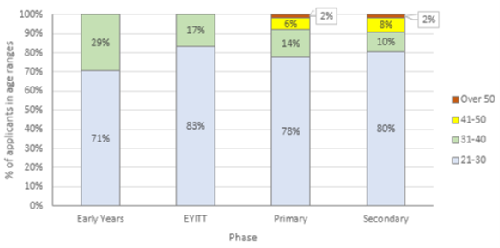
Figure 1.2: Age demographics of applicants by phase, recruitment cycle 2017-18
When studying the age demographics of CTE applications as shown in the above graph, Early Years and EYITT show no applicants over 40, but with far fewer applicants overall, these phases are difficult to compare with Primary and Secondary. The Secondary phase shows a slightly higher proportion of younger (21-30) applicants. Primary phase shows a slightly higher proportion of applicants over 50.
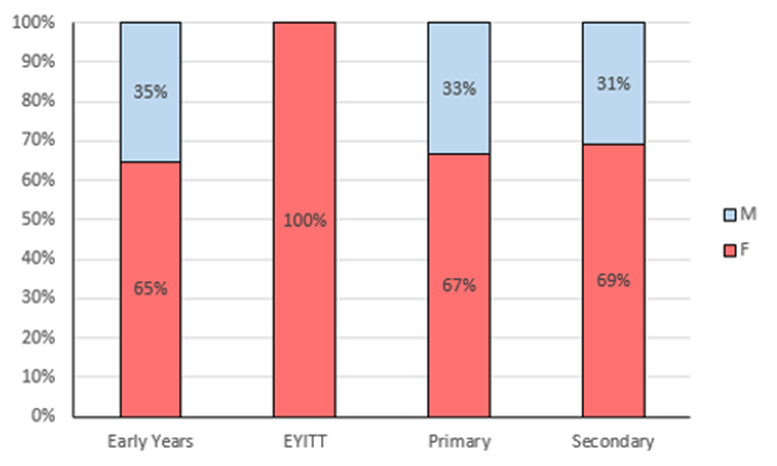
Figure 1.3: Gender demographics of applicants by phase, recruitment cycle 2017-18
In recent years, we have seen an increase in males being accepted on the PGCE Core programme. Typically most primary providers have 10-15% male trainees so CTE does very well against this figure. We will explore this area of our work further to include a greater understanding of male applicants onto all primary ITE routes alongside accepted offers and progress whilst on the PGCE programme.
There are remarkably similar proportions of degree classes for Secondary and Primary PGCE with 20% for both Primary and Secondary holding a 1st class honours degree and 47% holding a 2:1 for both phases. 30% and 31% for Primary and Secondary respectively hold a 2:2. The similarities here of entry qualifications are fascinating! Early Years and EYITT, although a small cohort, have a much larger proportion of 1st class degree applicants and very similar 2:1s and 2:2s.
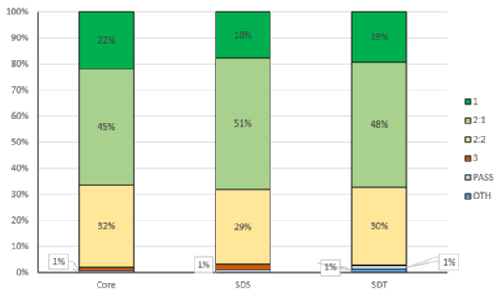
Figure 1.4: Degree classifications of applicants by route, recruitment cycle 2017-18
When considering the home location of our applicants, responses indicate that PGCE students whether university-led or School Direct (SD), tend to return to their home location to study. Through the SD route, particularly salaried, many trainees identify their chosen school to train to teach, which is often in their home town or city.
We are acutely aware that only small numbers of Warwick graduates identify teaching as their chosen profession and acknowledge that more should be done with academic departments to raise the profile and status of the profession. The national careers framework which states teaching as a ‘tier 2’ career, when medicine and other critical professions are rated as a ‘tier 1’ is not helpful. With the critical challenges the sector is facing in recruiting and retaining high calibre teachers into the profession, national messaging of this type is a significant concern.
We are working with academic departments at Warwick to ensure undergraduates (UGs) have the opportunity to explore teaching as a career and have developed the Warwick in Schools Programme (WiNS) to offer the 15/30 Credit Accumulation and Transfer Scheme CATS teaching module, now offered to a range of academic departments. Approximately 20% of WiNS students go onto an ITE programme, which is strong evidence to suggest the programme is contributing to recruitment into teaching. However, currently 2% of WiNS students go onto the PGCE programme at Warwick which is an area for review and development. We are keen to explore with WiNS students why they chose the module and during the module, has their view of teaching and the teaching profession changed.
With the Minister’s recent ITE selection criteria announcements on my mind, a robust approach to getting under the skin of fully understanding our application and recruitment data over-time may make this task just a little more challenging.
Kate Ireland – Director, Centre for Teacher Education, University of Warwick
Data analysis and graphs created by Sam Cruickshank – Data analysis, CTE
Writing guidance
Can I write about anything in my blog post?
Yes pretty much. Academic cultural critique (Thomson and Mewburn, 2013) is always a good source of content for academic blogs. This can include (but is not limited to) comments and reflections on funding; higher education policy or academic life. You might also want to consider blogging about:
- Academic practice (Saper, 2006)
- Information and/or self-help advice
- Technical, teaching and careers advice
- Your research or practice
- How you’ve undertaken research
- The impact of research on your practice
- An area of research/practice that interests you
- Your teaching experiences/reflections
How long can my blog post be?
Each individual blog post should be no longer than 500 words. Long blocks of text are sometimes hard for readers to digest. Break up your content into shorter paragraphs, bullet points and lists whenever possible. Also include a list of keywords or tags as this makes it easier for Google to find your work.
Do I need to use citations?
No, this is a reflective piece so it does not need to include citations (but you obviously can include them if they are relevant).
Can I include links or images?
We would encourage you to include links to any articles that you have considered whilst writing your blog post. We also welcome the use of images (as long as you have permission to use them) as they can often help to illustrate a point and obviously will not be included in the word limit. Please remember this is a public site so if you want to include images of your students in your classes then you will need permission to do this.
What is the process for submitting a piece of work?
Your blog post should be emailed to A.Ball.1@warwick.ac.uk. Once the submission has been reviewed it will either be uploaded at the beginning of the next available week or sent back to you for editing if it requires amendments. You should then send the amended work to me once again and I will then upload it.