
IM942 Visualisation Foundations
IM942
Visualisation Foundations

15/20/30 CATS - (7.5/10/15 ECTS)
TERM 1
Visualisations have become a fundamental currency for the exploration of data and the exchange of information. In this module we will explore this highly interdisciplinary subject from a wide variety of views - from cartography to statistics, to architecture and information design, and from science to the arts. Some of the labs and activities will involve coding and sketching activities, but there are no pre-requisites for this course. We encourage students from diverse backgrounds to bring their own perspective and skills to this exciting and interdisciplinary topic.
Module Convenors - Dr Greg McInerny
Indicative Syllabus
Week 2 to Week 8 - Lectures
Through these lectures we will use a variety of lenses in order to understand ‘visualisation’ as objects, a set of methods and as an interdisciplinary subject. We will start out by charting the origins of visualisation in mapping and quantitative graphics, and then exploring the contemporary boom in visualisation. The lectures will explore how we decode information from graphics, and how the effectiveness of a visualisation can depend on the task, data characteristics and a variety of literacies. After examining some of the frailties of visualisation (as a medium used to reveal and communicate) the topics will move into controversies that can uncover the science and art of visualisation. Finally we will turn to other forms of critique, using principles from Critical Cartography and Feminist Science and Technology Studies. What are the limits of visualisation?
Week 1 - Information Visualisation – Then & Now
Week 2 - The Fundamental Visualisation Principles told through Small Multiples
Week 3 - Decoding Errors and Precision
Week 4 - Controversies in Visualisation – visual junk, rainbows and censorship
Week 5 - Critical Visualisation – where are the limits of visualisation?
Week 7 - Reasoning with Visualisations
Week 8 - Design-ing Visualisations
Week 2 to Week 8 - Coding Labs
In these weekly coding labs we will learn how to visualise data in ‘R’, the Statistical Computing Language. R is a great choice as it is free, user friendly, open source and is capable of straightforward calculations to the most complex of analyses. We do not expect any prior experience in coding, only that you have completed the introduction to R workshops. As highlighted in this NY Times article, R skills are in great demand wherever there is a need to understand data. Whether it is Business (Air BnB, Google), Data Analytics, Science, Government and NGOs, or Academia, R has become one of the ‘industry standards’ for data analysis and visualisation. And of course R is used in data journalism, including the BBC, Financial Times, 538 and the New York Times.
Week 1 – Introduction to Graphics in R
Week 2 - Formatting graphics in R
Week 3 - Layouts and Panels in R
Week 4 - R Packages and Project Work
Week 5 - Project work and Feedback
Week 7 - Sequences of visualisations - inference, reflection and narratives
Week 8 - Re-purposing and re-designing visualisations for different contexts
Week 9 & Week 10 - Labs
In these lab spaces of the final two weeks we will experiment with how visualisations can be created in order to examine their affordances and the issues surrounding those affordances. Each visualisation lab will focus on an activity/task that uses different methods, tools and subjects to investigate how visualisation(s) relate to data, spaces, ourselves or software. The hands on tasks/activities allow students to explore questions surrounding, for example, technology, interactions, representation and design choices.
Week 9 - Theme 1
Week 10 - Theme 2
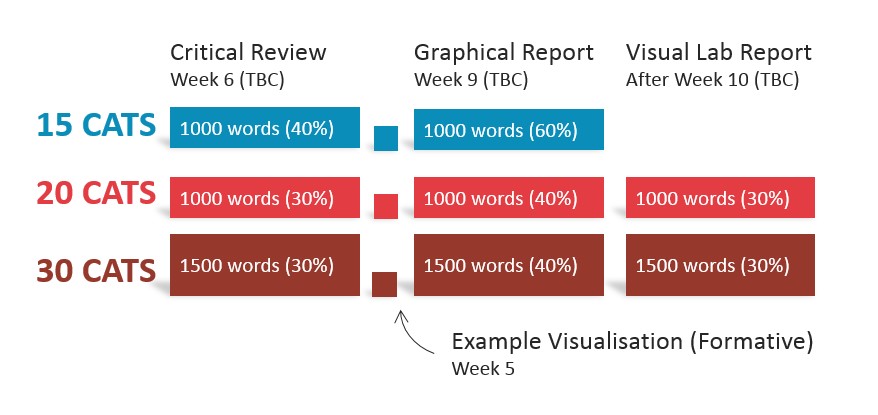
Assessment
Illustrative Bibliography
Bertin, J. (2010). Semiology of Graphics: Diagrams, Networks, Maps. Esri Press.
Cairo, A. (2012). The Functional Art: An Introduction to Information Graphics and Visualization. New Riders.
Few, S. (2013). Information Dashboard Design.
Meirelles, I. (2014). Design for Information - An Introduction to the Histories, Theories, and Best Practices Behind Effective Information Visualizations. Rockport.
Tufte, ER. (2001). The Visual Display of Quantitative Information. Graphics Press, USA.
Ware, C. (2012). Information Visualisation - perception for design. Morgan Kaufmann
Learning Outcomes
By the end of the module, students should be able to:
- Demonstrate an understanding of visualisations and their usage in a wide variety of applications;
- Explain the nature of visualisation as an interdisciplinary subject;
- Demonstrate an understanding of the role of technology in changing visualisation practices;
- Demonstrate an appreciation of the trade-offs involved in developing visualisations through examples;
- Explain the range of affordances that different visualisations can offer through examples;
- Evaluate visualisations in terms of users and tasks, and best practices and aesthetics;
- Understand and demonstrate the core skills required to create effective visualisations.