
3rd year Data Science Student Projects
Data science projects
This is an extended, individual piece of work which forms a core element of the third year of the BSc and the MSci Data Science courses. Students have the opportunity to apply practical and analytical skills in an innovate and/or creative way, to synthesise information, ideas and practices to provide a quality solution, and to evaluate that solution. They develop the ability to self-manage a significant piece of work. Students choose a topic and supervisor from the Statistics or the Computer Science department.
The project includes a progress report, an oral presentation, and an extended final project report. Students not only learn about the research project themselves, but they also experience different phases of project organisation and delivery. The work extends over about seven months, which introduces students to the management of a longer piece of work and the time management and task planning associated with this.
What students say
" Unlike most other final year modules, this project gives you the opportunity to own a piece of work that you have truly chosen yourself. I spoke to several supervisors before deciding on one and would recommend that you take the time to do this too, as this may be one of the longest pieces of work you complete during your university career! Throughout the project, I loved the freedom and flexibility with which I could structure my time. I also found the work I did for my dissertation to always be a refreshing change from most module formats. It provided ample opportunity for you to tailor the methods you use to match your desired technical skillsets. I learnt a lot working with my supervisor and found the process of working with a more experienced and knowledgeable staff member to be invaluable. I would recommend making use of their expertise and experience, as they are there to support you and want you to succeed. "
Mai-An Dang, BSc Data Science 2021
Animal movement modelling with signatures
Callum Ellard (3rd year BSc Data Science project)
Modelling animal GPS data with stochastic analysis to feed machine learning algorithms for classifying behaviour
Human development and expansion are causing the destruction of animal habitats and the rapid loss of species. Some of the most effective ways to protect these animals can be determined from examining their behaviour in their ecosystems.
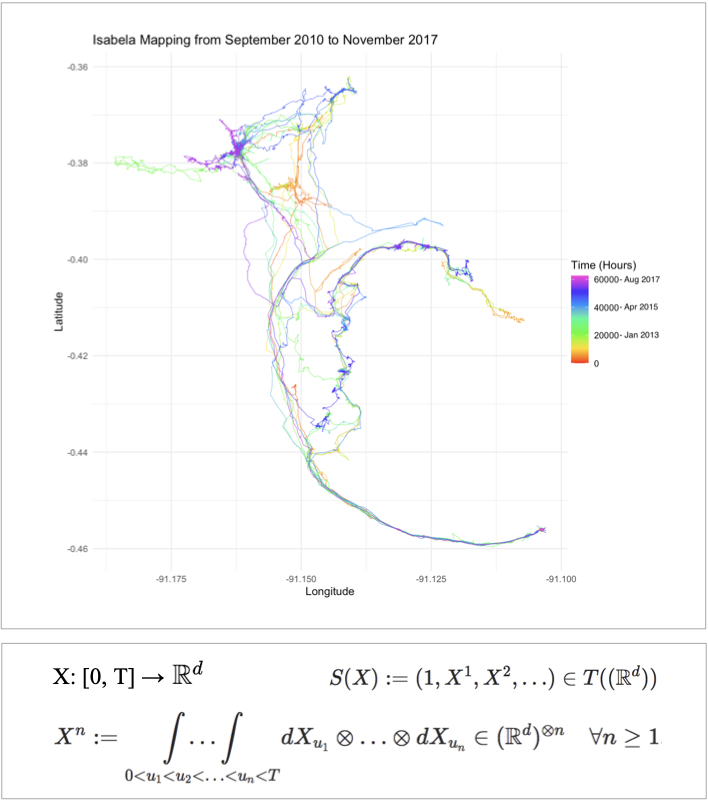
This work explores the use of animal Global Positioning System data with the signature method [1] shown in the formula for a continuous d-dimensional path X. It has been used to summarise complex path with little a priori knowledge about data characteristics in other applications. Machine learning tools including random forest, stochastic gradient boosting, and extreme gradient boosting were then used to classify animal behaviour based on outputs from the signature method. Model performance was evaluated using average accuracy, average kappa, and average AUC. This method to classify animal behaviour produced some effective models and the results indicated the signature method could be a valuable addition to existing methods, such as Hidden Markov models.
One of the case studies is Isabela, a female Galapagos tortoise of the species Chelonoidis vandenburghi on Isabela Island, with a dataset containing roughly 39,000 datapoints. The figure shows the entirety of her dataset, from September 2010 to November 2017, with the colour indicating the number of hours elapsed since the first datapoint. The travel is migratory with various stopping points, where other types of movement occur. The tortoise and vulture datasets used in the project were obtained from the openly accessible online repository for animal movement data [2].
[1] Chevyrev et al, A Primer on the Signature Method in Machine Learning, 2016, https://arxiv.org/pdf/1603.03788.pdf, [2] www.movebank.org.
Performance indicators in asymptomatic SARS-CoV-2 detection
Yingning Shen (3rd year BSc Data Science project)
Calculating COVID-19 screening scheme testing errors using iterated conditional probabilities and implementation in a web app
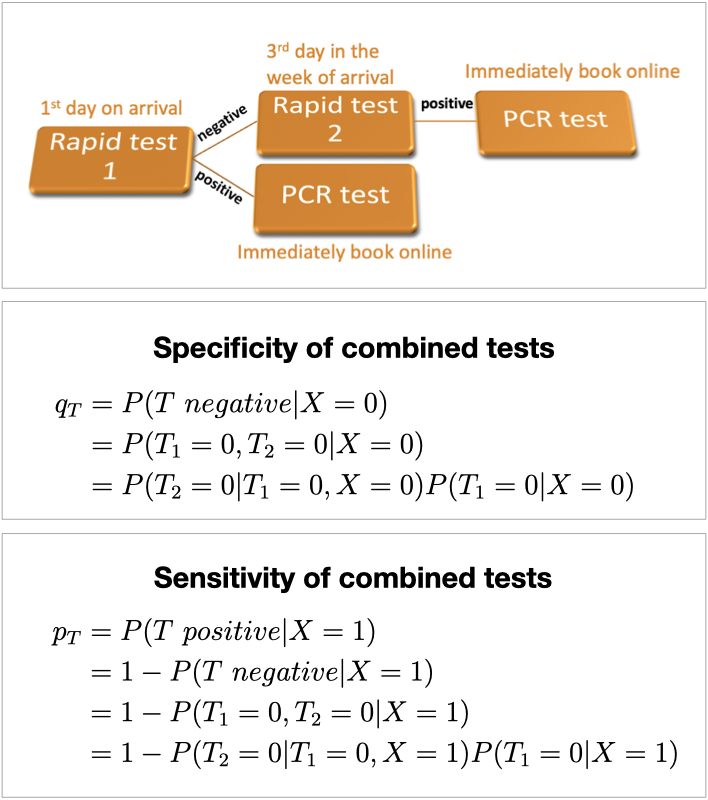
Suitably designed screening programs can help limiting infection rates in the current global COVID-19 pandemic before sufficiently many people have been vaccinated. Such schemes detect otherwise missed asymptomatic cases, allowing positively tested people self-isolate rather than infecting others. The government or employers may require participating in testing schemes involving rapid Lateral Flow Tests (LFT) or laboratory-based PCR tests. Students may be asked to take two LFTs when returning to campus for face-to-face learning, followed by two LTFs per week. However, the potentially high testing error rates have triggered an ongoing controversy, among experts and in the public discourse, about ethics, effectiveness, and efficiency of such schemes [1, 2].
The first task was to derive probabilistic formulas for the error rates for a few alternative testing schemes. They would differ by the types of tests involved and by the mechanisms how the results of individual tests would be combined. Based on that, performance indicators of such schemes were evaluated across different sets of assumptions about specificity, sensitivity and infection incidence in the screened population.
The theoretical results were used to build a web app. This can be used to compare the outcomes of different testing schemes by running simulations under a battery of alternative assumptions about the above mentioned parameters. Such tool can support evaluation, designs and implementation of screening schemes tailored for a given setting (e.g. educational institution, work place, event).
[1] Gill et al, Mass testing for covid-19 in the UK, BMJ 2020;371:m4436, [2] Mina et al, Rethinking covid-19 test sensitivity — a strategy for containment, NEJM, vol 383, no 22, 2020
Decision models on beet yield and their agri-environmental consequences
Elizabeth Potter (3rd year BSc Data Science project)
Data visualisation and multi-agent multi-step decision approaches to longitudinal agricultural data
In the recent past, biodiversity levels in the UK have been dropping as more land is being converted to agriculture. How can agricultural decision making achieve high crop yield while maintaining environmental sustainability? We are interested in the impact of weed control on both yield and biodiversity [1, 2] with a particular focus on wild pollinators and their crucial role for the ecosystem.
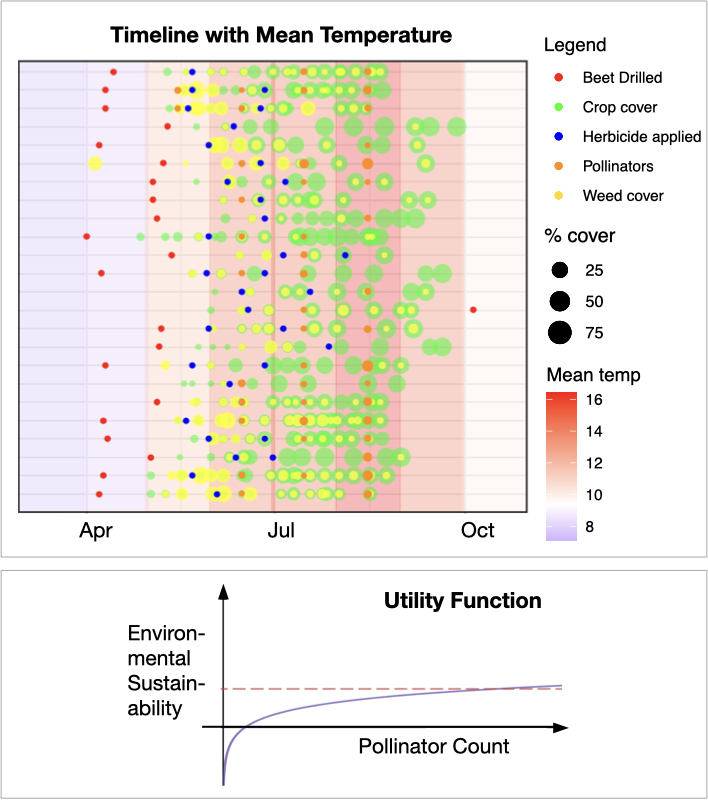
We develop visualisation tools that show the temporal evolution of key events in crop growth in parallel for multiple farms against a backdrop coloured by meteorological factors such as temperature (top figure) or rain fall. The project utilised the raw data from the beet experiments in the 2003 Farm-Scale Evaluations (FSE) [3] repository. Data quality assessment and the interpretation is conducted keeping in mind the overall sparse availability of high-quality data in this domain.
Exploratory and correlation analysis of the variables involved is followed by the construction of multi-step decision models. Utility functions can be used to govern the optimisation of decision tasks. They can, for example, be used to quantify environmental sustainability as a function of pollinator count (bottom figure).
We build an interactive web app for users to create temporal plots according to their own specifications. Our visualisation tool can also be used for data from different domains, e.g. showing the numbers of GP appointments against temperature.
[1] BBC Future Maddie Moate, "What would happen if bees went extinct?", May 2014, [2] Food and Agriculture Organization of the United Nations, "Why bees matter", 2018, [3] Woiwod et al, Farm scale evaluations of herbicide tolerant genetically modified crops. J. Applied Ecology, 40(1):2– 16, 2003.
Tools for managing risks and uncertainties in big project management
Shiyu Chen (3rd year project, BSc Data Science)
Modelling and simulating the contribution of extreme risks inherent to subtasks of large projects to the overall project's value at risk
Project management is a precarious domain that project managers and related personnel struggle to conquer. The uniqueness of projects and the unpredictability of risks make their management challenging, and complexity and size increase difficulties [1]. Despite in-depth study of controlling risks from various aspects such as finance, technology and human resources, a statistical perspective and a data-driven approach can add further insight and offer potential improvement of project outcomes.
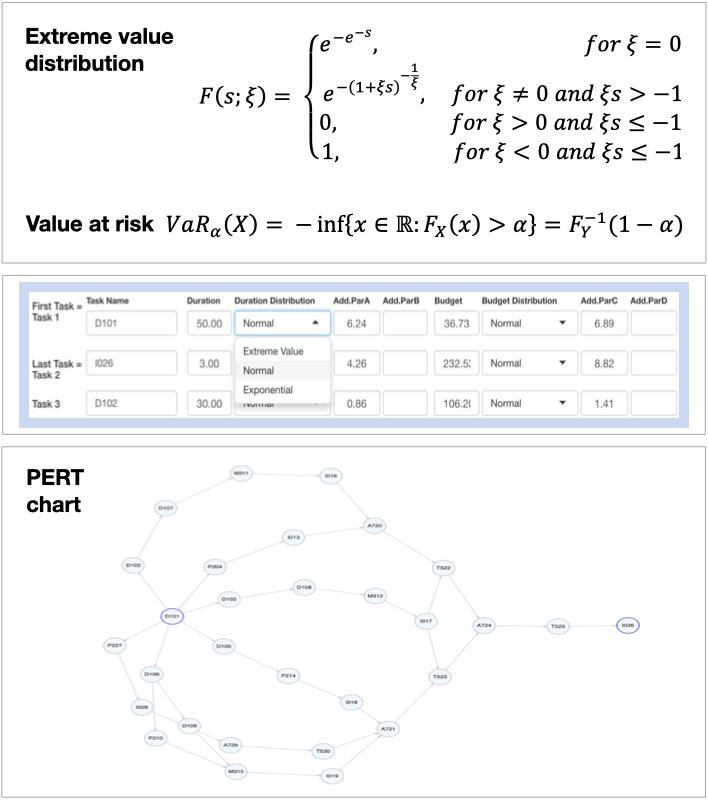
This project analyses how the probability distributions of the duration (time) and the budget (cost) of sub-tasks contribute to those of the project as a whole, which is defined by a work break down structure (WBS). Considering normally and exponentially distributed values for common situations, we also look at the case of extreme risks presented by the Weibull family. Combining this with the concept of Value at Risk allows the modelling of losses in the project management under a wide range of scenarios [2]. For calculations, Monte Carlo simulations are superior to the variance-covariance method. This is because they allow more flexibility for the distributions of the factors involved. Non-uniqueness of the critical path also needs to be considered.
The methods are implemented in a web application developed through R Shiny and the extRemes package [3]. It produces a PERT chart, finds possible critical paths, and generates simulations for the project. The analysis graphs provided can be used to calculate the value at risk at a given confidence level.
[1] Locatelli et al, The Successful Delivery of Megaprojects: A Novel Research Method, Project Management Journal, Project management journal, 48(5), 2017, [2] Pilar et al, A comprehensive review of Value at Risk methodologies. The Spanish Review of Financial Economics, Issue 12, 2014, [3] Gilleland, CRAN - Package extRemes, https://cran.r-project.org/web/packages/extRemes/index.html
Detecting, visualising and analysing dependencies in big project management
Mai-An Dang (3rd year project, BSc Data Science)
Modularisation of big projects into small tasks with a network view and critical path distribution
Around 9 out of 10 large infrastructural projects go over budget [1]. Unfortunately, megaprojects – projects with budgets over $1 billion [2] – have persistently experienced poor performance over time and across the globe [3]. The motivation for this project is to provide better insight into complex project structures. The objective is to achieve this by analysing dependencies between variables in large projects from a statistical point of view.
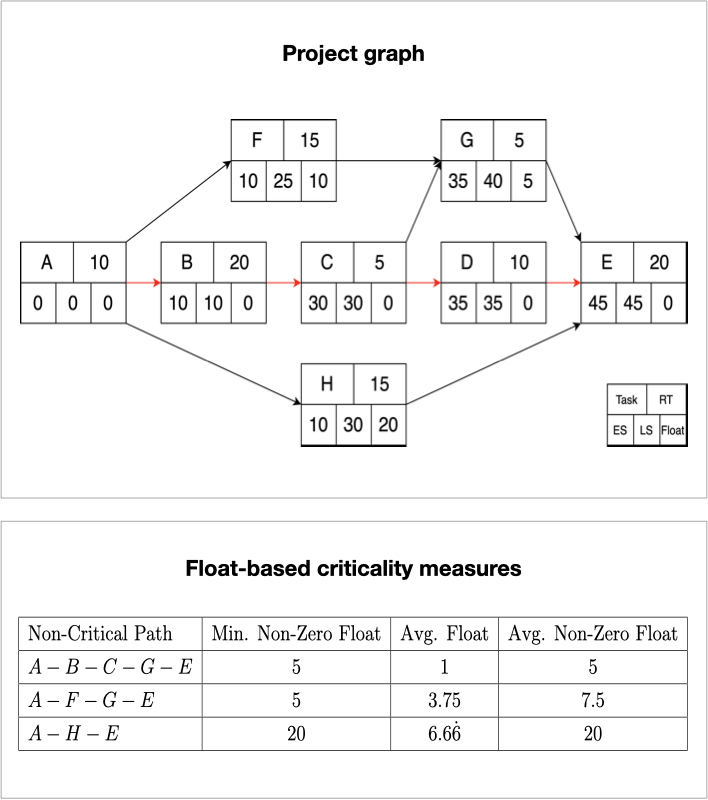
This work challenges existing project management processes and proposes a stochastic approach to project management network scheduling techniques. In particular, this work extends the notion of a critical path from the existing critical path method by considering the concept of criticality, a measure to rank non-critical paths within work packages.
This work first considers defining projects as stochastic processes such as Markov processes and decision processes. The focus then moves towards network scheduling techniques. A large proportion of this work was spent on manually implementing a stochastic critical path method in the statistical programming language R.
Finally, several recommendations for a criticality measure are made. All of the defined and proposed criticality measures for non-critical paths are based on task floats or the distribution of entire paths as random variables.
[1] B Flyvbjerg. Megaproject Policy and Planning: Problems, Causes, Cures. Sum- mary of Dissertation for Higher Doctorate in Science, (Dr. Scient.), Aalborg Univer- sity, 2007. URL https://ssrn.com/abstract=2278265, [2] C Fiori and M Kovaka. Defining megaprojects: Learning from construction at the edge of experience. In Construction Research Congress 2005. American Society of Civil Engineers, 2005. URL https://ascelibrary.org/doi/pdf/10. 1061/40754(183)70, [3] B Flyvbjerg. What you should know about megaprojects and why: An overview. Project Management Journal, 45(2):6–19, April 2014. URL https://arxiv.org/ftp/arxiv/papers/1409/1409.0003.pdf.