
4th year Integrated Masters Dissertation Projects
Integrated Masters dissertation
During the 4th year, MMathStat, MMORSE, and MSci Data Science students work on a research project with the support of a member of the lecturing staff. This allows students to synthesise, apply and extend the knowledge and skills developed during the taught component of the course and to demonstrate mastery of some elements of Statistics and Data Science. It also equips students to work on a long term project and pick up project management skills.The wide range of topics reflects the broad spectrum of interests of academics, and in some cases, suggestion brought forwards by students or external collaborators.
What students say
"During the project, not only you can explore the area of your own interest, but also it feels great to build something upon the knowledge and skills you gained from the last three years. Besides, it is really a rewarding experience to meet regularly with your project supervisor and peers. You can learn a lot from them. Moreover, although I was nervous before the presentation, I found it quite exciting when I finished. It is indeed a challenging process where you can really improve yourself. Overall, doing the project was one of the most valuable experiences during my university time."
Anbang Du, MMORSE 2021
Examples of past student projects
Diversity of a set of items consumed by users with applications to streamed music
Ollie Rosoman (4th year Integrated Masters Dissertation, BSc MMORSE)
Extending concepts such as entropy to establish mathematical measures for diversity in Spotify playlists
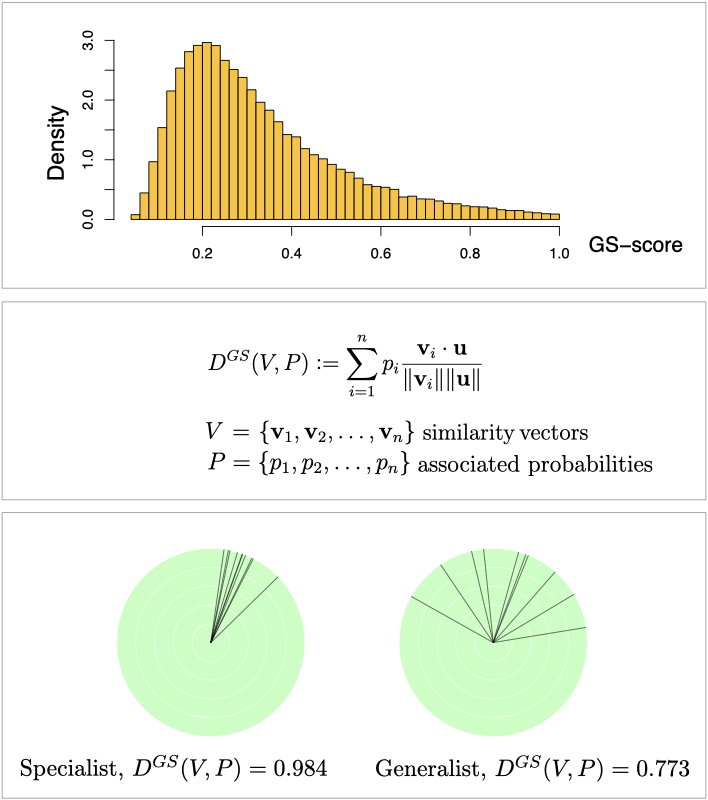
The popularity of music playlists among listeners have been associated with levels of diversity with respect to mood, genre and other characteristics. Past approaches to the measurement of diversity of a set of items focussed on one or two of three important aspects: the cardinality, the evenness of the distribution, and the similarity between the items.
This report studies the advantages and disadvantages of key existing diversity measures [2], including Richness, entropy-based measures (Shannon and Rényi), Gini-Simpson index, Hill numbers, Sharma-Mittal generalisation, and Generalist-specialist score. It further proposes a number of novel approaches which prove very compelling.
One of our proposed scores, the trio diversity measure, provides a unification of the three key aspects of diversity, performing excellently on a large music activity dataset when compared to popular existing measures.
The quantification of diversity is a difficult challenge, as individuals will often disagree about which factors are the most relevant and often have very different objectives. It deemed important then, that the context should be given careful consideration, which was partly why implementation on real music streaming data was carried out. The Taste Profile subset [3] provided real data from music streaming sourced from an undisclosed source and contains over 1 million unique users and around 385,000 unique songs.
[1] Anderson et al (2020), Algorithmic Effects on the Diversity of Consumption on Spotify, WWW’20: Proceedings of The Web Conference 2020: 2155–2165, [2] Chao et al (2014), Ecological monographs 84, 45–67, [3] Bertin-Mahieux et al (2011), The Million Song Dataset, Proceedings of the 12th International Conference on Music, Information.
Bias correction in citizen science data repositories
Vidoushee Jogarah (4th year Integrated Masters Dissertation, BSc MMORSE)
Developing statistical models to account for sampling biases due to factors such as weather and animal behaviour in UK butterfly data
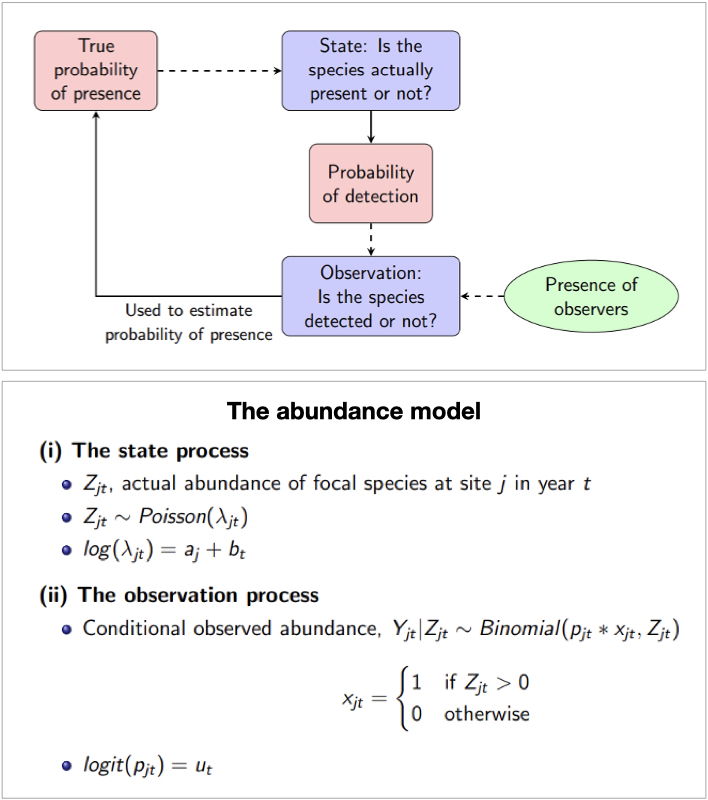
Ecological data collected by volunteers, also known as “citizen science” data, has become an important tool for scientific research and environmental policing globally. However, without a fixed sample design, the data collected can be subject to recording biases. This, in turn, affects the conclusions drawn from analysis of such data and hinders the ability to obtain robust observations regarding important trends in ecological data.
This project builds upon the findings that the occupancy detection model, a Bayesian hierarchical model described by the flowchart, is robust to four types of sampling biases: (i) uneven recording intensity over time, (ii) bias in visits across sites, (iii) uneven recording effort, and (iv) uneven probability of detecting a species [1].
The aim of the project is to build a model, which is as robust as the occupancy detection model but which uses abundance rather than presence-absence data to detect trends in occupancy.
To do so, a large real-life citizen science dataset [2] was studied containing butterfly counting data over 43 years across more than 3000 sites in the UK. Data was then simulated to resemble this dataset, with non-random adjustments to simulate the different scenarios of recording bias as well as a 30% decline in abundance. The model constructed is evaluated by its ability to detect this decline from observed abundance in each biased scenario.
[1] Isaac et al (2014), Statistics for citizen science: extracting signals of change from noisy ecological data, Methods in Ecology and Evolution 5(10), 1052–1060, [2] Botham et al (2020), United kingdom butterfly monitoring scheme: site indices 2019.
Ranking test match bowlers
Gabriel Musker (4th year Integrated Masters Dissertation, BSc MMathStat)
Using Bayesian computational methods to compare bowlers’ "true abilities" on a level playing field across eras
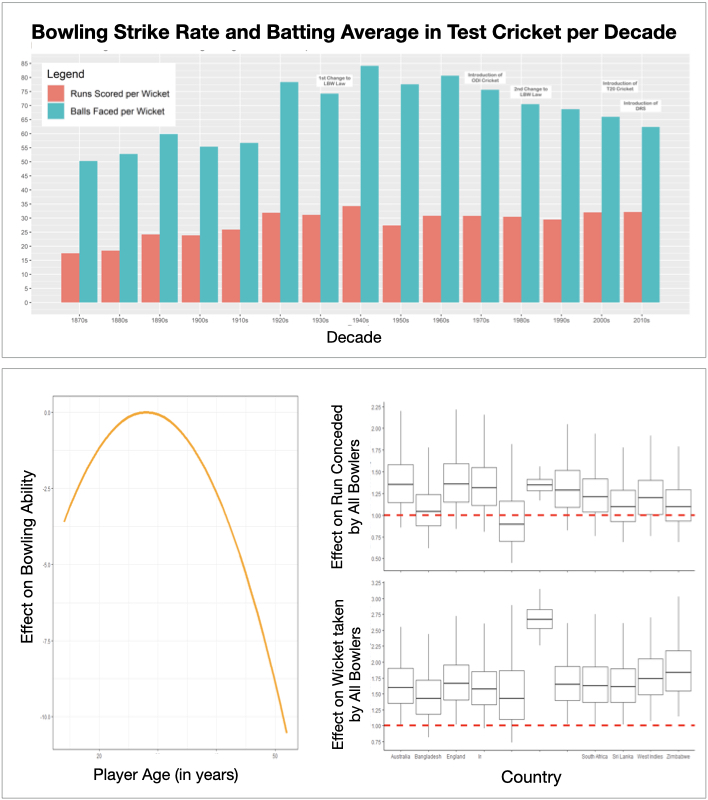
Test cricket is a sport that lends itself to statistical analysis better than almost any other, and recent advances in data collection have led to a boom in in-depth, micro-analyses of players and teams. However, with the sport going through a huge number of changes in its 145-year history, a great debate still rages on: is it fair to compare players across eras, and if so, what adjustments need to be made?
This project applies Bayesian computational models to historical Test match data to effectively evaluate the difficulty of conditions surrounding bowlers’ performances throughout history, creating a baseline on which to compare bowlers from different eras and answer that very question.
A model for re-contextualising a batsman’s average was first proposed by [1]. Modelling “true ability”, they considered several factors, notably the quality of the opposition and the difficulty of the decade of play (which has varied significantly due to changes in the laws of the game and pitch preparation methods, amongst other things).
This paper builds on that work, modelling bowlers’ performances by considering both runs conceded and wickets taken, as well as the aforementioned contextual variables and others. Factors influencing a bowling performance were evaluated using a Bayesian hierarchical model, with posterior distributions for bowlers’ “true ability” parameters being estimated using the Hamilton Monte Carlo algorithm based software package [2].
[1] Boys et al (2018), On the Ranking of Test Match Batsmen, Journal of the Royal Statistical Society, Series C, vol. 68, no. 1, pp. 161-179, [2] Team (2021), Stan Modeling Language Users Guide and Reference Manual, V2.27.
Ergodicity of limit order book (LOB) Markov chains
Harry Mantelos Sapranidis (4th year Integrated Masters Dissertation, BSc MMathStat)
Using SDEs to derive generators of Markov processes modeling LOB evolution and prove their ergodicity
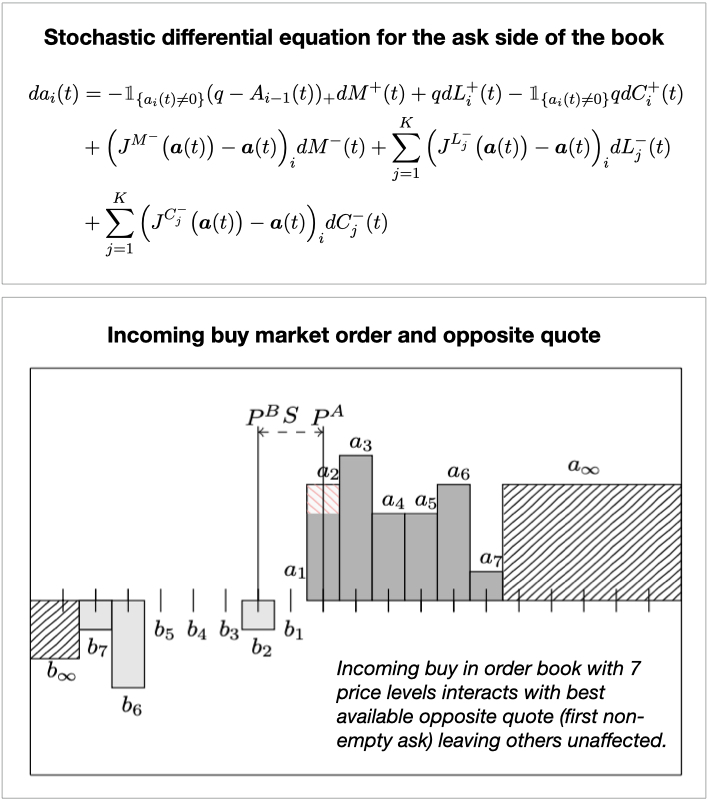
A Limit Order Book (LOB) contains all the orders and essential characteristics submitted by traders and serves to connect buyers and sellers. We consider a market with three types of orders: limit orders (price at which a trader is willing to buy/sell a specific number of shares any time) and cancellation orders of these, and market orders (immediately buy/sell a certain quantity of shares). The stochastic evolution of the LOB can be modelled by continuous-time Markov processes with all the different order submission given by Poisson processes [1, 2].
In this project, we also studied the embedded Markov chain of this process (in discrete time), only dealing with the times at which there is a change in the shape of the order book (as a result of incoming orders), as well as some interesting variants of the model e.g. changing assumptions on the intensities of the Poisson processes for the different orders. We describe the evolution of the shape of the LOB by a stochastic differential equation driven by Poisson processes and use this to derive the generator/transition operator which infinitesimally characterise the movement of the Markov process/embedded Markov chain.
Using stochastic stability theory (cf [3]) we use our previous results to prove a very important property of the models: ergodicity. This ensures that our process will eventually have a particular distribution, regardless of the initial distribution. What is more, we prove that this stabilization happens exponentially fast.
[1] Abergel et al, Limit Order Books, Physics of Society: Econophysics, CUP, 2016, [2] Rama et al, A stochastic model for order book dynamics, Operations Research, 58:549-563, 06 2010, [3] Meyn et al, Markov Chains and Stochastic Stability, Cambridge Math Library, CUP, 2009.
Shuffling algorithms and users’ perceptions of randomness with application to streamed music
Anbang Du (4th year Integrated Masters Dissertation, BSc MMORSE)
Defining randomness for playlists using concepts from card shuffling and applying runs tests to Spotify data
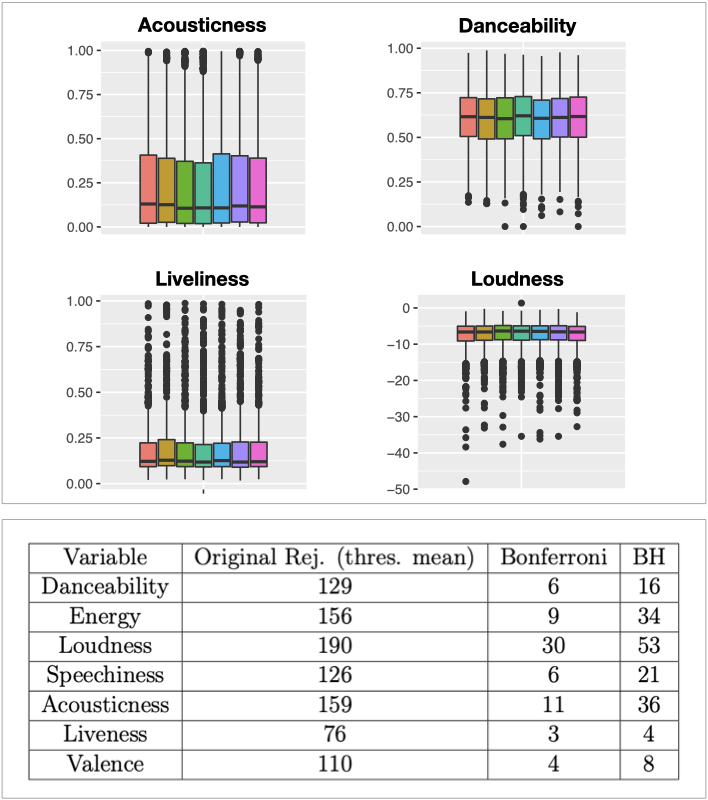
The shuffle play option in music streaming Apps like Spotify is meant to provide a feeling of randomness to users. If the order of a list of songs feels random to a user, are the songs in a truly random order? It is known that subjective perception of randomness does not necessarily correspond to the mathematical concepts of randomness [1]. The first part of this project focusses on the meaning of true randomness in the sense of probability theory. We embed this in a discussion of card shuffling theory including top-in-at-random shuffle and riffle shuffle [2].
The second part of this project incorporates the idea of randomness in the analysis of the Million Playlist Dataset introduced in the RecSys Challenge 2018 [3]. The collective distributions of music features of the first several songs in all playlists does not exhibit any particular pattern, which raises the question whether they may occur at random. This motivates the usage of the runs test to investigate dependencies between items in individual playlists. The theories and applications of runs distribution in the binary case and the k-category extension of runs test are discussed in this section.
In the final part of this project we address the multiple testing problem caused by simultaneous application of the runs test to nearly 1000 playlists. Correction methods include the Bonferroni and the False Discovery Rate (FDR). We prove that how the Benjamini-Hochberg procedure controls the FDR.
[1] Bar-Hillel and Wagenaar, The perception of randomness, Advances in applied mathematics 12.4 (1991), [2] Aldous and Diaconis, Shuffling cards and stopping times, in The Amer. Mathem. Monthly 93.5 (1986), [3] Chen et al, Recsys Challenge 2018: automatic music playlist continuation, Proc. of the 12th ACM Conf. on Recommender Systems, Vancouver, BC, Canada: Assoc. for Computing Machinery, 2018, https://doi.org/10.1145/3240323.3240342.
Supervised machine learning of game-styles in tennis
Nicolai Williams (4th year Integrated Masters Dissertation, BSc MMORSE)
Comparing several clustering techniques for characterising and classifying game-style in tennis
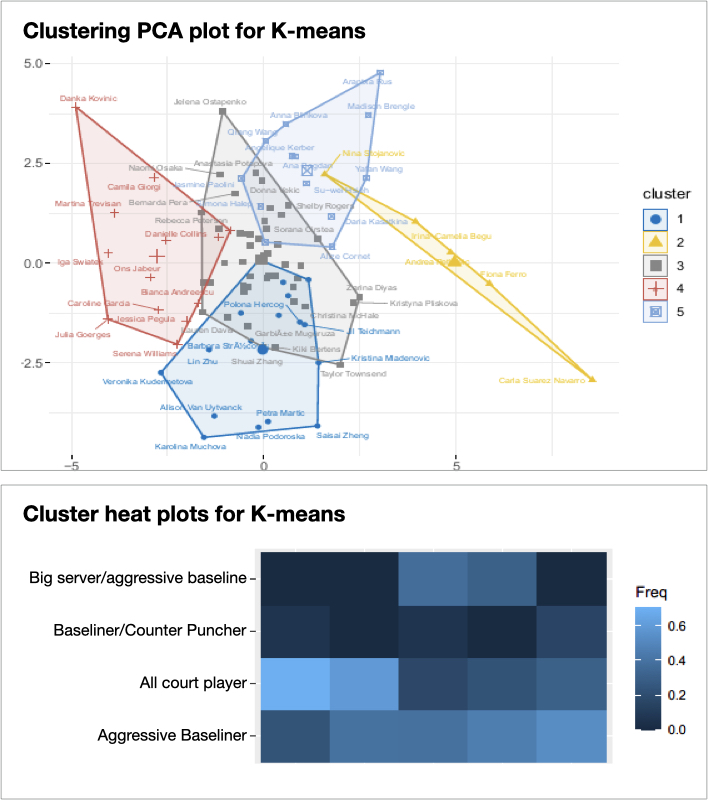
Game-styles in tennis are characteristics that are evident to both players and tennis professionals. Players have different strengths and utilise them in customised strategies. Coaches attempts to classify players have resulted in lists of player game-styles, but so far this was based on expert judgement, rather than statistical methods.
This project made use of LTA point-by-point match data to characterise players using summary metrics, which were evaluated using discrimination and stability meta-metrics originally designed for NBA player data [1] ensuring sufficient discriminatory power. The refined summary metrics were firstly implemented and validated as part of a supervised machine learning approach based on K-means (shown in figure), K-medoids and Hierarchical Clustering algorithms to see what natural groupings would form and how many clusters would best split the data. Secondly, they served to train a classifier to see if it is possible to accurately classify the game-style of a new tennis player not used to train the classifier.
We showed that game-styles defined by the LTA are somewhat validated by our statistical analysis. Patterns in the clustering analysis and the numbers of clusters identified show a clear resemblance to the LTA game-styles. In particular, the All Court Player characterises a cluster by all 3 of the clustering algorithms indicating that this game-style is not only extremely appropriate, but also well allocated.
[1] Franks, Alexander et al, Meta-Analytics: Tools for Understanding the Statistical Properties of Sports Metrics, 2016.
Functional data analysis of dynamic optoacoustic tomography
Shakera Haque (4th year Integrated Masters Dissertation, BSc MMORSE)
Early detection of hypotoxia to improve medical treatment outcomes in cancer therapy
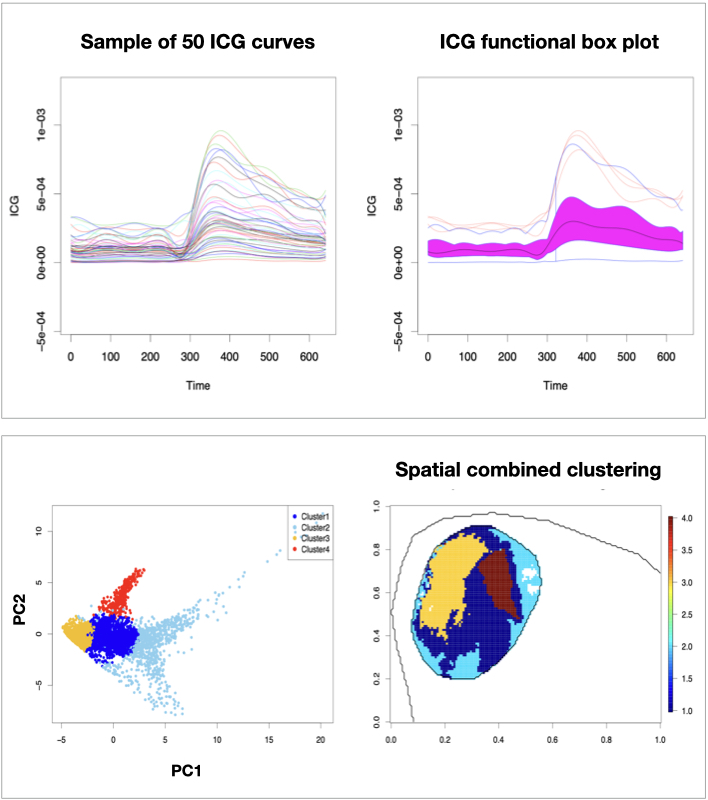
Solid tumour tissues are often oxygenated non-uniformly, leading to regions of oxygen deficiency (hypoxia) linked to resistance to cancer therapies in patients. Early and preferably non invasive discovery of hypoxia in cancer patients could help aid their therapy. Dynamic Optoacoustic Tomography (OT) is an emerging imaging technology creating series of static spatial images displaying biological characteristics within tissue.
This project uses data from dynamic OT of a mouse injected with tumour cells to derive measurements over time of its tumour oxygenation (SO2), and perfusion (blood flow), following a change in environment from air to 100% oxygen and following the injection of the contrast agent ICG respectively. By understanding relationships between tumour oxygenation and perfusion, hypoxia detection is potentially possible at an earlier stage.
Functional data analysis methods such as spline smoothing are used to model the ICG and SO2 values for each pixel in the OT images as smooth trajectories over time, as well as account for noise in the data. Functional clustering is used to formally group regions of the tumour based on the oxygenation and perfusion of each pixel, while functional PCA is used to explore the individual modes of variation across the tumour spatially. The results corroborate those of the original papers in this area, with distinct oxygenation and perfusion in the rim and core of the tumour [1,2], whereby the core of the tumour showed little or no response to the changes in environment, while the rim showed rapid response much like the surrounding healthy tissue.
[1] Tomaszewski, M., Gehrung, M., Joseph, J., Q. G. I., Disselhorst, J., and Bohndiek, S. (2018). Oxygen-enhanced and dynamic contrast-enhanced optoacoustic tomography provide surrogate biomarkers of tumor vascular function, hypoxia, and necrosis. Cancer Research, 78(20):pp. 5980–599.[2]Tomaszewski, M., Gonzalez, I., O’Connor, J., Abeyakoon, O.and Parker, G., Williams, K., Gilbert, F., and Bohndiek, S. (2017). Oxygen enhanced optoacoustic tomography (oe-ot) reveals vascular dynamics in murine models of prostate cancer. Theranostics, 7(11):pp. 2900–2913.
Option pricing and hedging with execution costs and market impact
Nikolaos Constantinou (4th year Integrated Masters Dissertation, BSc MMORSE)
Comparing alternative stochastic models for stock price evolution and numerical solutions of PDE obtained via a splitting technique
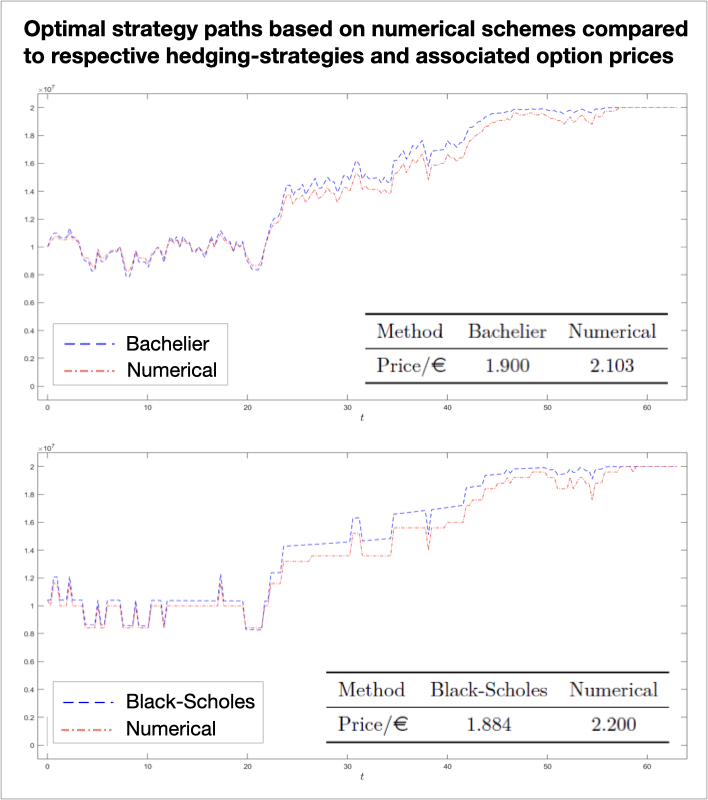
Option pricing theory is well developed in terms of credit risk of an option contract, with the celebrated Black-Scholes model for pricing vanilla options being a leading example. On the other hand, liquidity risk is not as advanced, partially perhaps due to the various practicalities one can face in intraday trading situations, which constantly densify, and subsequently because of the lack of a formal definition on what liquidity really is about.
Our study aims to price vanilla options, with a given nominal, by embodying frictions in a delicate manner. In particular, the modelling approach of imperfections is revolved around the continuous time model [2], a recent contribution to the literature on option pricing. Their framework is based on [1], whose work on optimal execution is concerned with another broad area of Financial Mathematics problems. However, the Almgren-Chriss framework deviates from the conventional log-normal stock price dynamics as it works on a Bachelier model, where the stock price is assumed to have a Gaussian evolution instead, so that this gives rise to the second, and inevitably more complex, model in our study.
Discussing each of the two problems from scratch, we were able to make some inference about the price and strategy effect of various parameters of interest and to compare across the arithmetic and geometric Brownian motion stock price problems. Most notably, in both modelling approaches we stress indeed the departure from the perfect market setting in terms of both option prices and hedging strategies (see figure) via a numerical example, whose derivation relies on numerically solving relevant PDEs via a splitting technique.
[1] Almgren and Chriss, Optimal execution of portfolio transactions. Journal of Risk, 3:5–39, 2001, [2] Guéant and Pu, Option pricing and hedging with execution costs and market impact, Math. Finance, 27:803–831, 2017.