
National LGBTQUIA+ Population Insight
Why is the Census 2021 data important?
Stonewall summarised the importance of sexual orientation and trans identity data collection within the Census in this Twitter thread (click the link below to access the full thread):
The #Census2021 data released today shows the number of openly LGBTQ+ people in England & Wales for the first time.
— Stonewall (@stonewalluk) January 6, 2023
But while visibility is important, the data will also help us campaign to improve the lives of LGBTQ+ people - from healthcare to homelessness. Here's how ⬇️ https://t.co/I56PzdrUmz
What did the Census 2021 ask?
Census 2021 questionnaires are available online here.
Of particular note for national LGBTQ+ population insight, the Census 2021 was the first UK Census to ask for respondents' sexual orientation, cis/trans identity and gender identity.
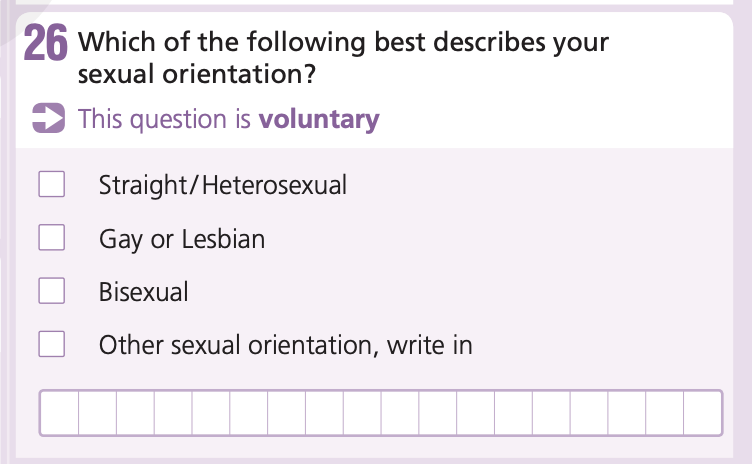
The sexual orientation question (see below) was optional, and only for completion by those aged 16 and over. It offered three sexual orientation options, as well as an "other sexual orientation" option alongside a write-in field. It did not explicitly include response options for sexual orientations such as pansexual, asexual, or queer. It did not allow for multiple responses to be entered.
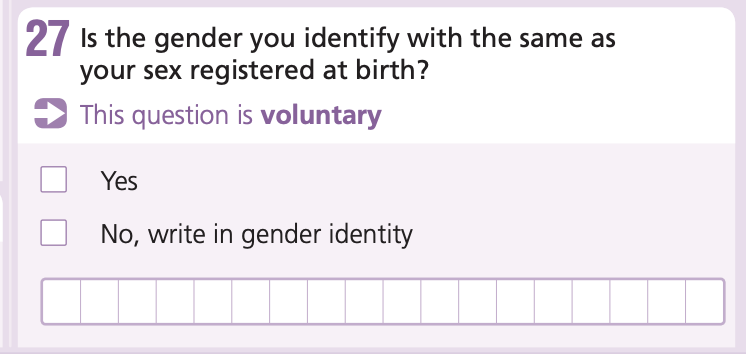
The cis/trans identity and gender identity question (see below) was optional, and only for completion by those aged 16 and over. It offered two response options, 'Yes' and 'No', along with the option to write-in a gender identity.
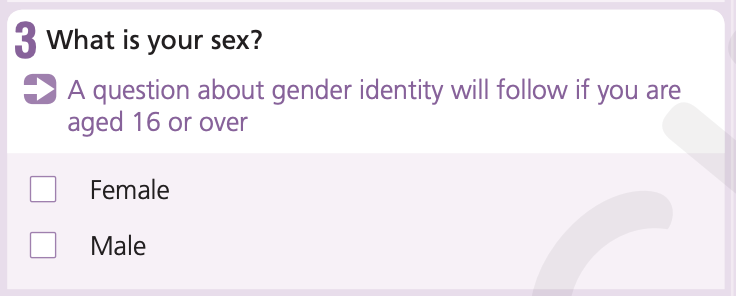
The sex question (see below) was mandatory, and for completion regardless of age. It offered two response options only, 'Female' and 'Male'. Census 2021 guidance for this question advised respondents to 'use the sex recorded on one of your legal documents such as a birth certificate, Gender Recognition Certificate, or passport.'
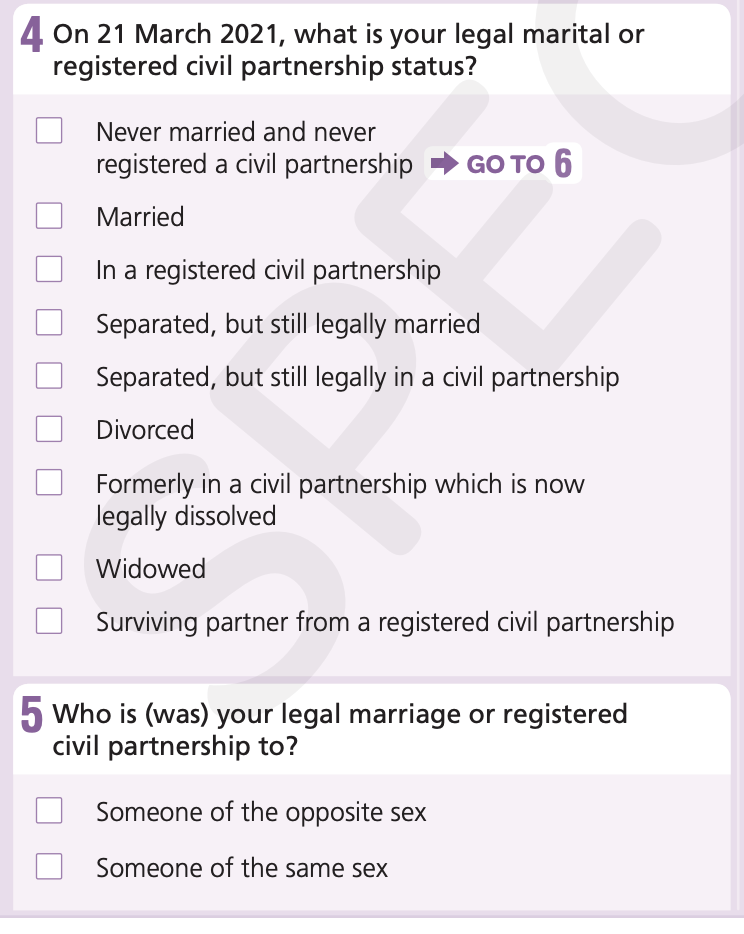
The legal marital and registered civil partnership status question (see below) was mandatory, and followed by a related mandatory question on the respondents' partner's sex if any response except 'Never married and never registered a civil partnership' was chosen. Response options in the follow-on question are limited to binary options of 'Someone of the opposite sex' and 'Someone of the same sex'.
Limitations of the Census 2021 data
There are significant limitations associated with the use of Census 2021 data to gain national LGBTQ+ population insight. Considerations include that:
- Questions are often completed on someone else's behalf (particularly for younger people, and in family households).
- Unless an individual return is requested, responses are visible to whoever has access to your household questionnaire.
- Disclosure is not anonymous, forming part of the record the state holds for an individual and their household.
- Personally identifiable data is only kept confidential for 100 years, at which point it is published.
- Trust in the Government and how they will use the data collected is low within the LGBTQUIA+ community nationally. Whilst there are assurances of confidentiality and legal rights as data subjects, this does not preclude individual misuse or future changes to the law law.
- The possibility of a data breach is non-zero.
- The questions and responses included are limited. For some, they do not allow for accurate representation of of their identities and experiences.
- Sexual orientation is not always a good predictor of attraction or relationships, which were not asked or asked only in a limited context e.g. civil partnership and marriage partners' sex.
- Limited response options encourage some to choose an option which is not a 'perfect fit' as opposed to being 'othered' through the use of a write-in field e.g. choosing 'bisexual' rather than writing in 'pansexual'.
- Only one response could be entered, despite multiple identities/labels often being held or used by an individual e.g. queer and bisexual, asexual and gay.
- There was no recognition of romantic attraction in the census questions.
- The binary nature of legal sex recognition, and the associated Census 2021 guidance means that many trans people (including all non-binary people) are mis-categorised as female or male in sex data analysis.
- The sexual orientation and trans/gender identity questions were optional, and only presented to those aged 16 and over.
- Certain communities where LGBTQUIA+ are overrepresented are underrepresented in census returns, including homeless people and those with no fixed address.
Sexual orientation & the Census 2021
The Census 2021 statistical bulletin on sexual orientation can be found here.
How many people chose to answer the sexual orientation question?
- 92.5% of the population (aged 16 and over) answered the question.
- 7.5% of the population (aged 16 and over) did not answer the question. This equates to 3.6 million people.
What proportion of the population identify as heterosexual, lesbian, gay, bisexual or other minority sexual orientations?
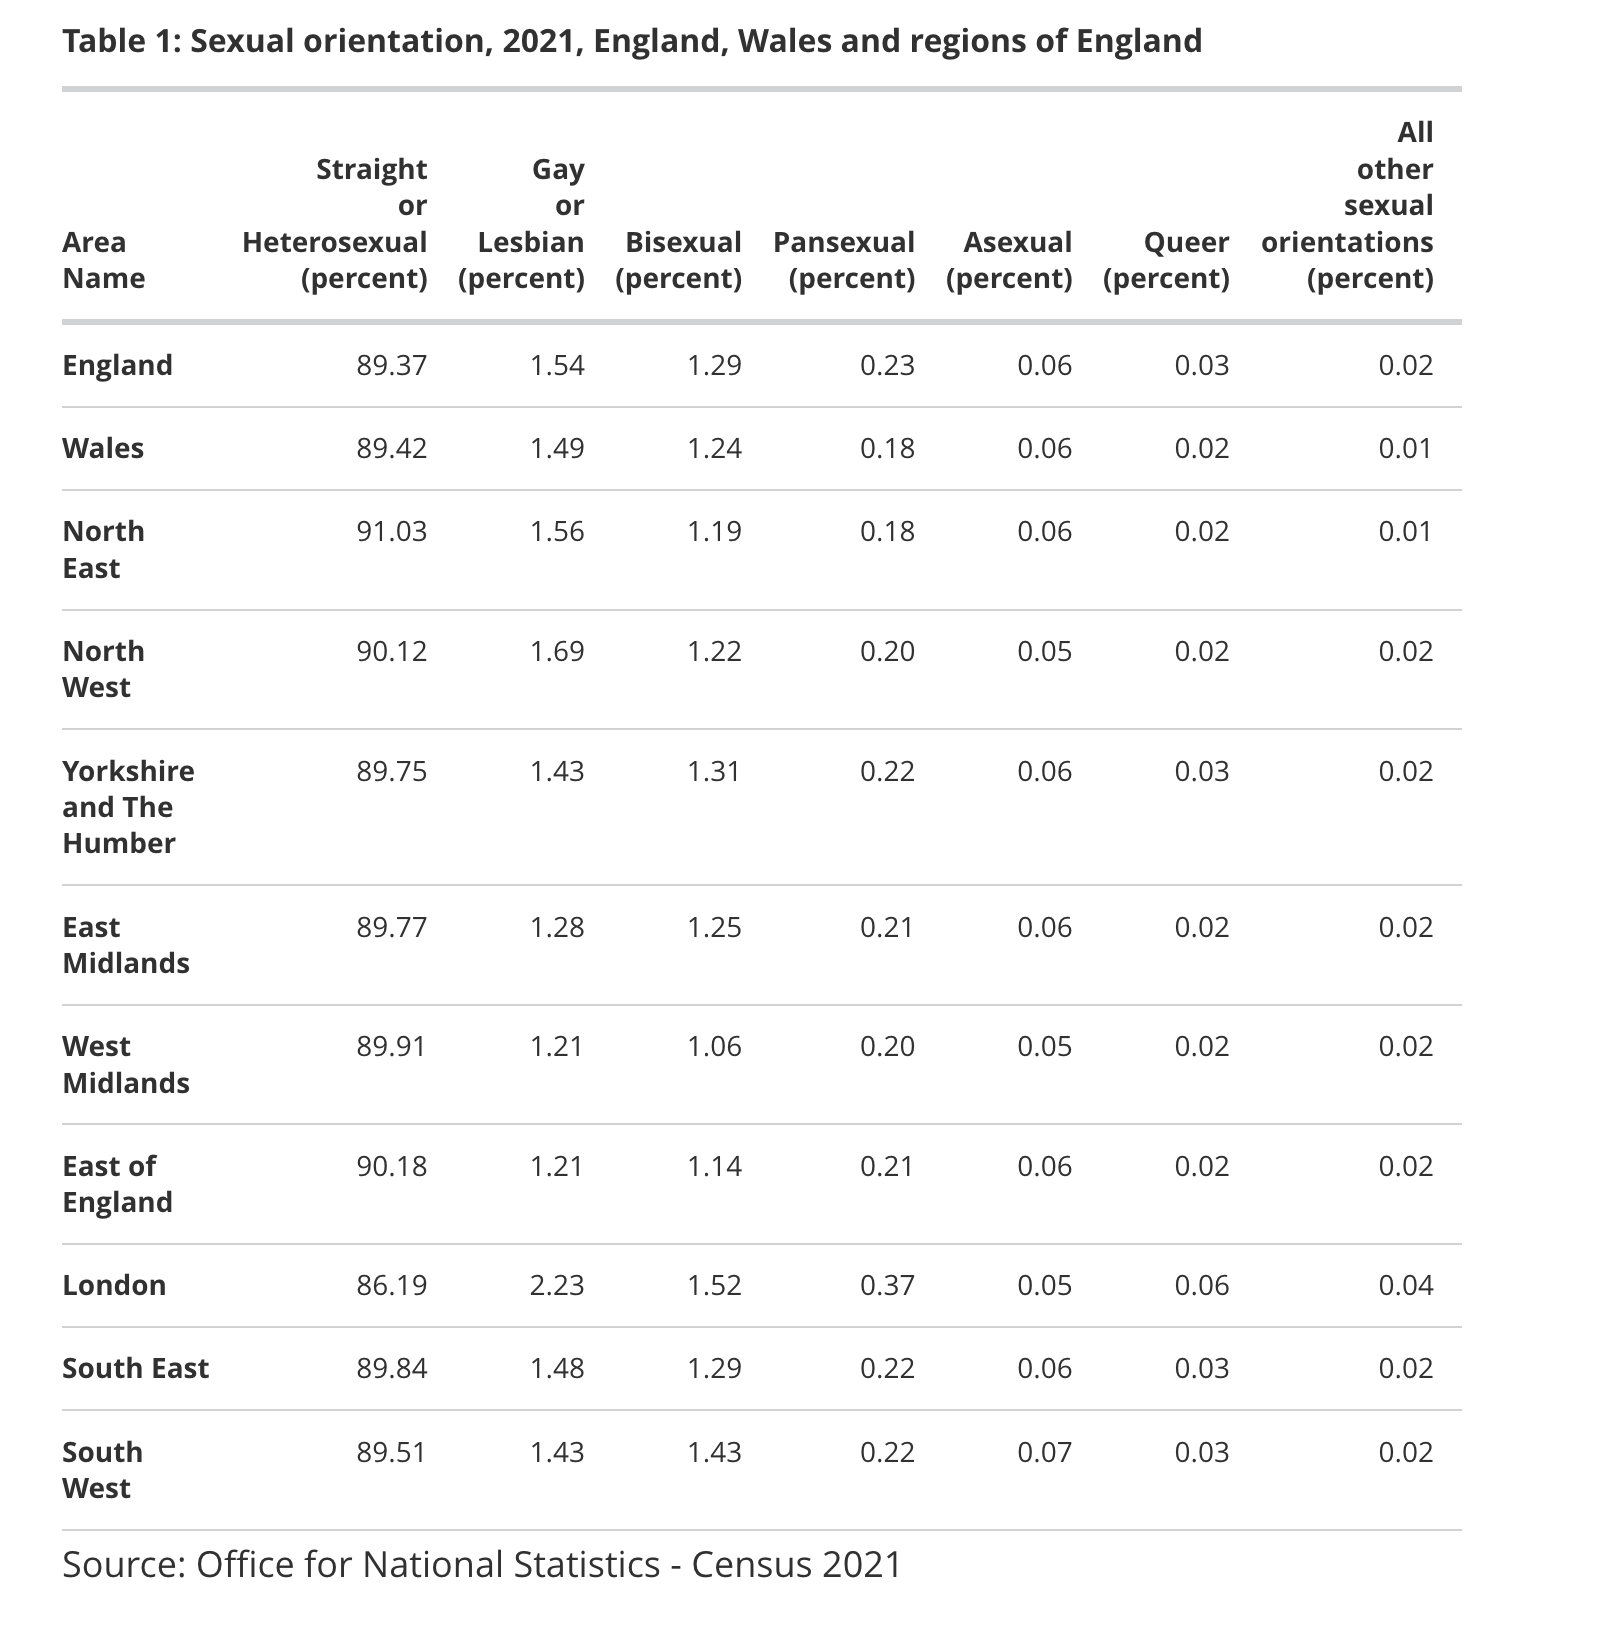
- Around 43.4 million people (89.4%) identified as straight or heterosexual.
- Around 1.5 million people (3.2%) identified with an LGB+ orientation (“Gay or Lesbian”, “Bisexual” or “Other sexual orientation”).
- Gay or lesbian: 1.54% (748,000)
- Bisexual: 1.28% (624,000)
- Pansexual: 0.23% (112,000)*
- Asexual: 0.06% (28,000)*
- Queer: 0.03% (15,000)*
- All other sexual orientations: 0.02% (10,000)*
*These identities were write-in as "other sexual orientation" options.
How does sexual orientation vary across England and Wales?
The data showed few differences between the two nations with respect to sexual orientation. England and Wales had very similar proportions of people who identified as:
-
straight or heterosexual (89.4% of the population aged 16 years and above in both England and Wales)
-
gay or lesbian (1.5% in both England and Wales)
-
bisexual (1.3% in England, 1.2% in Wales)
-
any other sexual orientation (0.3% in both England and Wales)
The percentage who did not provide an answer was also very similar (7.5% in England, 7.6% in Wales).
[Source]
The local authority with the largest LGB+ population among those aged 16 years and over was Brighton and Hove (10.7%). Seven out of the top 10 were in London, with the largest populations in the City of London (10.3%), Lambeth (8.3%), and Southwark (8.1%). In Wales, the local authorities with the largest LGB+ populations were Cardiff (5.3%), Ceredigion (4.9%), and Swansea (3.4%).
You can explore the map by local authorities here.
How does sexual orientation vary by age?
The Census 2021 statistical bulletin on sexual orientation by age and legal sex can be found here.
The prevalence of lesbian, gay, bisexual and other minority sexual orientation people decreases with each successive age group; 6.91% of people aged 16 to 24 (despite being more likely to live with parents unaware of their sexual orientation, and the associated barriers to disclosure in the Census), 5.63% of people aged 25 to 34; 3.50% of people aged 35 to 44, 2.39% of people aged 55 to 64, 0.84% of people aged 65% to 74%, and 0.37% of people aged 75 years and over.
Looking at a breakdown of lesbian and gay responses and bisexual responses by age group, there is a greater decrease in bisexual responses with successive age groups, compared to lesbian and gay responses. In fact, the prevalence of lesbian and gay respondents is higher in the 25 to 34 years age group than in the 16 to 24 years age group, falling from 2.59% to 2.11%. The 16 to 24 years age group is the only age group where people are more likely to be bisexual than gay or lesbian (combined), with people almost twice as likely to be bisexual than gay or lesbian (combined).
How does sexual orientation vary by legal sex?
The Census 2021 statistical bulletin on sexual orientation by age and legal sex can be found here.
Of those who disclosed they were lesbian, gay, bisexual or another minority sexual orientation in their Census return...
- 3.32% of people reported their legal sex as female
- 3.00% of people reported their legal sex as male
LGB+ people were more likely to report a legal sex of female than male in the 16 to 24 years and 25 to 34 years age groups, but were more likely to report a legal sex of male than female in all other age groups. The prevalence of LGB+ people decreased with increasing age group for both legal sex categories, except between the ages of 16 to 24 and 25 to 34, where the prevalence of LGB+ people with a legal sex of male actually increased from 4.5% to 5.09%.
Those who reported a legal sex of female were less likely to be gay or lesbian, compared to those who reported a legal sex of male, but more likely to be bisexual, pansexual, asexual and queer.
Trans identity & the Census 2021
The Census 2021 statistical bulletin on trans and gender identity can be found here.
How many people chose to answer the 'gender identity' question?
- 45.7 million (94.0% of the population aged 16 years and over) answered the question.
- 2.9 million (6.0% of the population aged 16 years and over) did not answer the question
How many people reported that their gender identity was different to the sex they were assigned at birth?
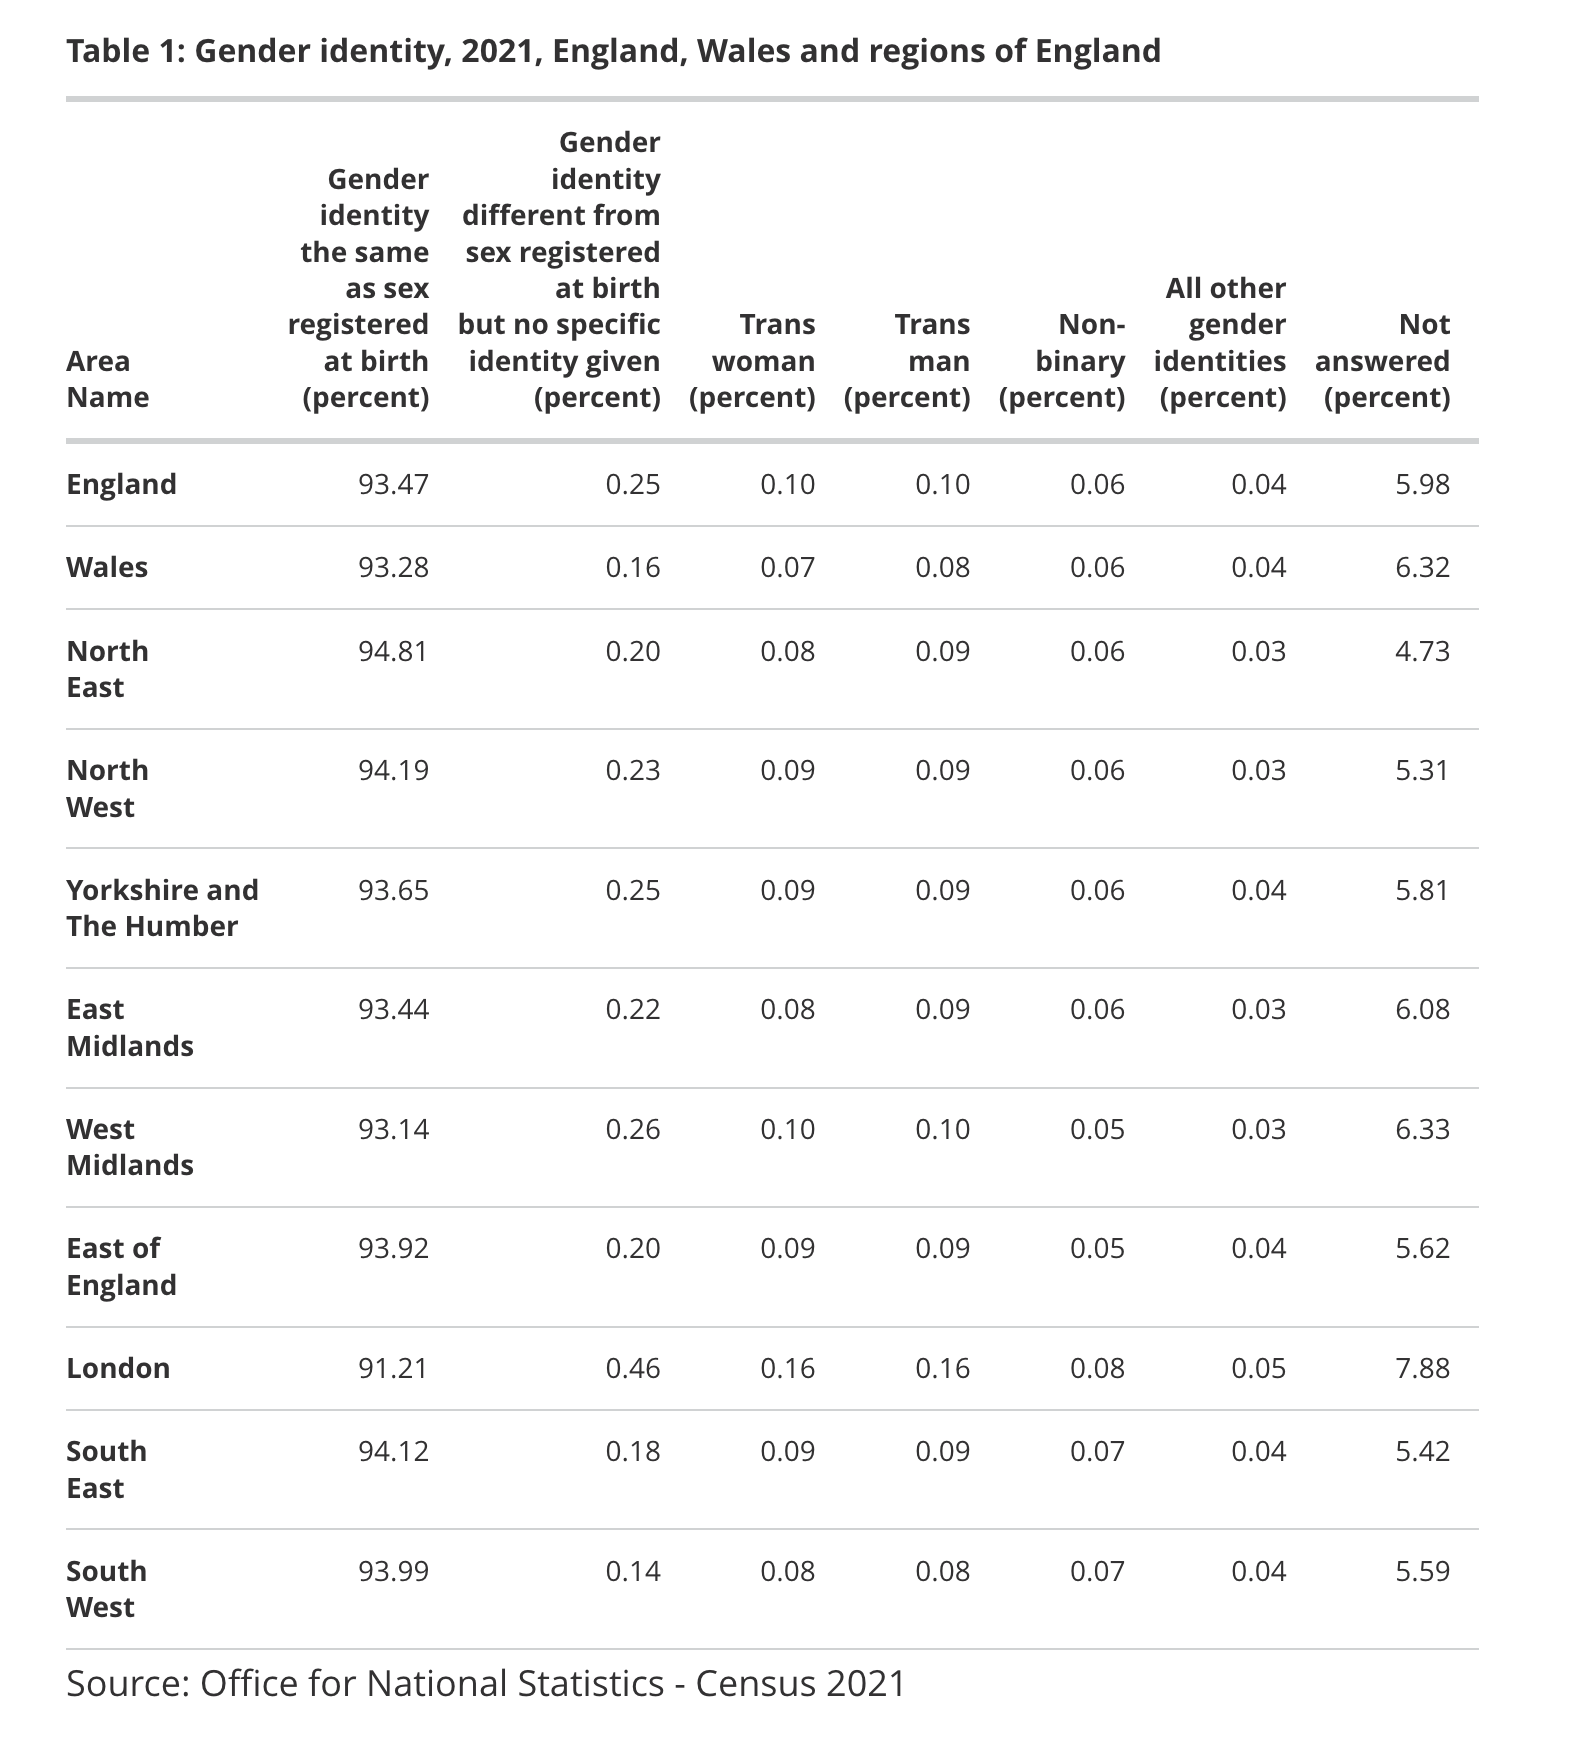
- 45.4 million (93.5%) reported that their gender identity is the same as the sex they were assigned at birth i.e. cis people.
- 262,000 (0.5%) reported that their gender identity is different from the sex they were assigned at birth i.e. trans people.
Of those that reported their gender identity was different to the sex they were assigned at birth, what is their gender identity?
Of the 262,000 (0.5%) of people who reported that their gender identity was different to the sex they were assigned at birth, the gender identity breakdown was as follows:
- 48,000 (0.10%) male
- 48,000 (0.10%) female
- 30,000 (0.06%) non-binary
- 18,000 (0.04%) another gender identity
- 118,000 (0.24%) did not provide a write-in response
How does cis & trans identity vary across England & Wales?
The prevalence of people who reported a gender identity different to the sex they were assigned at birth was slightly higher in England, at 0.55%, than in Wales (at 0.40%).
The region in England & Wales with the highest prevalence of people who reported a gender different to the sex they were assigned at birth was London, at 0.91%, with the South West having the lowest prevalence, at 0.42%.
[Source]
Of the 10 local authorities with the largest proportion of people whose gender identity was reported as different from their sex assigned at birth, 8 of the 10 were in London, with Newham (1.51%) highest and Brent (1.31%) second highest. The two non-London local authorities in the top 10 were Oxford (1.25%), which was third, and Norwich (1.07%), which was ninth. In Wales, the local authorities with the highest percentages were Cardiff (0.71%) and Ceredigion (0.70%).
How does cis/trans identity vary by age?
The prevalence of people whose gender identity is different from the sex they were assigned at birth decreases with each successive age group; 1.00% of people aged 16 to 24 (despite being more likely to live with parents unaware of their trans identity, and the associated barriers to disclosure in the Census), 0.77% of people aged 25 to 34, 0.64% of people aged 35 to 44, 0.47% of people aged 45 to 54, 0.33% of people aged 55 to 64, 0.25% of people aged 65 to 74, and 0.22% of people aged 75 years and over.
How did trans people report their legal sex?
Not all trans people were able to record a legal sex in line with their gender identity i.e. if they did not have official documentation such as a passport or birth certificate with a legal sex marker that aligned with their gender identity.
- 66.2% of trans women had a legal sex of female, whilst 33.8% of trans women had a legal sex of male.
- 67.5% of trans men had a legal sex of male, whilst 32.5% of trans men had a legal sex of female.
There is no legal gender recognition of non-binary people in the UK so no non-binary people, or people with gender identities outside of male and female, were able to record a legal sex in line with their gender identity.
- 67.5% of non-binary people had a legal sex of female
- 32.5% of non-binary people had a legal sex of male
- 54.4% of people with another gender identity than male, female, or non-binary had a legal sex of female
- 45.6% of people with another gender identity than male, female, or non-binary had a legal sex of male
Younger trans people were less likely to report a legal sex in alignment with their gender identity, likely reflecting the increased difficulties they experience associated with changing legal sex marker on their official documents.
What does all this really tell us?
Although the Census does not offer a reliable population estimate for LGBTQ+ people in the UK, it does offer insight of value:
- It provides insight on how people respond to questions about sexual orientation, cis/trans identity, legal sex, and gender identity.
- It provides insight on (some) barriers to disclosure of sexual orientation, cis/trans identity, legal sex and gender identity.
- It highlights some of the limitations and wider issues associated with data analysis based on binary (male/female) legal sex categories, including misgendering of data subjects.
- It provides a lower bound on the LGBTQ+ population in the UK, specifically a lower bound on those with a sexual orientation other than straight/heterosexual, and a lower bound on trans people.
- It offers some insight into the relative prevalence of sexual orientations within the UK population, particularly in relation to the most frequent write-in responses (pansexual, asexual, and queer), and the higher prevalence of bisexuality in younger age groups.
- It highlights that LGBTQ+ people live in every part of the UK, rural and urban, and offers some insight into the relative prevalence of LGBTQ+ people by region.
- It offers insight into the relative prevalence of LGBTQ+ people by age, particularly in relation to the higher prevalence of non-heterosexual people and trans people in younger age groups.
- It offers insight into the relative prevalence of trans people's gender identities, binary and non-binary.
What does this mean for higher education?
- Given the age profile of their student population, the Census 2021 data offers HEIs an approximate lower bound for expected LGBTQ+ prevalence in their (UK/home) student population. This provides an initial measure for identifying underrepresentation of LGBTQ+ students in higher education institutions, as well as informing resource allocation.
- Contrary to prior research which suggested LGBTQ+ prevalence estimates below the lower bound offered by the Census 2021, almost 1 in 10 people aged 16 to 24 are known to be LGB+ and 1 in 100 people aged 16 to 24 are known to be trans.
- Similarly, given the age profile of their staff population, the Census 2021 data offers HEIs an approximate lower bound for expected LGBTQ+ prevalence in their staff population. This provides an initial measure for identifying underrepresentation of LGBTQ+ staff in higher education institutions, as well as informing resource allocation.
- The Census 2021 responses, reception of the questions, and the associated challenges and limitations with the data, collectively inform LGBTQ+ inclusive data collection best practice for use in higher education. This includes both staff and student demographic data collection, at (re)enrolment, during recruitment, and within staff inductions, particularly in relation to
- The Census 2021 data suggests HEIs should expect an increasing number of LGBTQ+ students (in terms of both sexual orientation and trans identity) in successive student cohorts, with a particularly large increase in female LGBTQ+ students and bisexual students. The specific needs and experiences of sub-communities within the LGBTQ+ community within higher education are poorly understood, and this insight may suggest sites of interest for further research.
- The scale of the difference in LGBTQ+ prevalence by age group highlights some of the challenges associated with effective consultation with, and representation for, LGBTQ+ people of all ages. In particular it points to difficulties ensuring adequate representation of older LGBTQ+ people, and of the limitations of cross-generational LGBTQ+ representation i.e. older/younger LGBTQ+ people may have limited insight into the needs and experiences of younger/older LGBTQ+ people.
- The Census 2021 responses highlight the potential impact of non-binary erasure, and reinforce the necessity of non-binary inclusive practices such as gender-neutral language and all-gender facilities on campuses.
- The mismatch between identity and legal documentation for some trans people, affecting trans people of all ages but particularly younger trans people, highlights some of the logistical issues HEIs should consider in relation to data collection, evidencing qualifications and experience, recruitment, and participation.
Questions or contributions?
This resource will be expanded upon as further Census 2021 data becomes available. Any questions, suggestions, requests, or contributions should be directed to Sam Parr.