
The Data Set and Thresholding
The Data Set:
From the raw data that was initially available we constructed our own data to work with. In took the form:
- Average size of school (fixed through time)
- Average absences per day due to illness along each week.
- SIR state.
- Latitude coordinate (fixed through time).
- Longitude coordinate (fixed through time).
for each one of the 367 schools along the 9 weeks that correspond to the epidemic period.
Thresholding:
The main challenge in constructing this data set was in determining the SIR state of the school. In order to do this we had to find a method of converting pupil absence data into a SIR value. This was done by what we call maximal thresholding.
Algorithm:
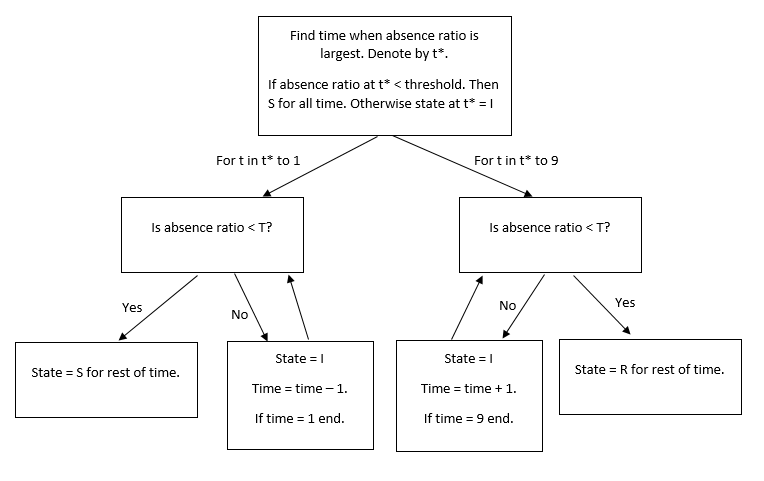
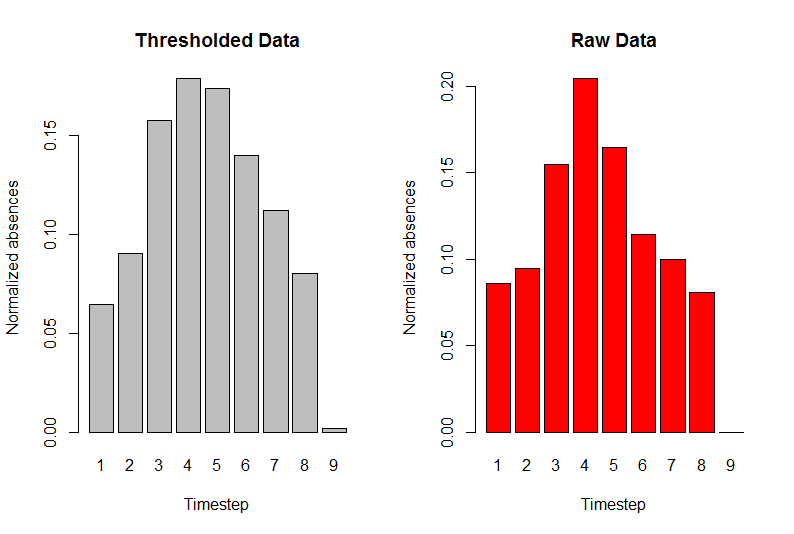
We then computed thresholds for each school by choosing the 83rd percentile of the absence ratio across the years of 2007 and 2008 (as this data was available).
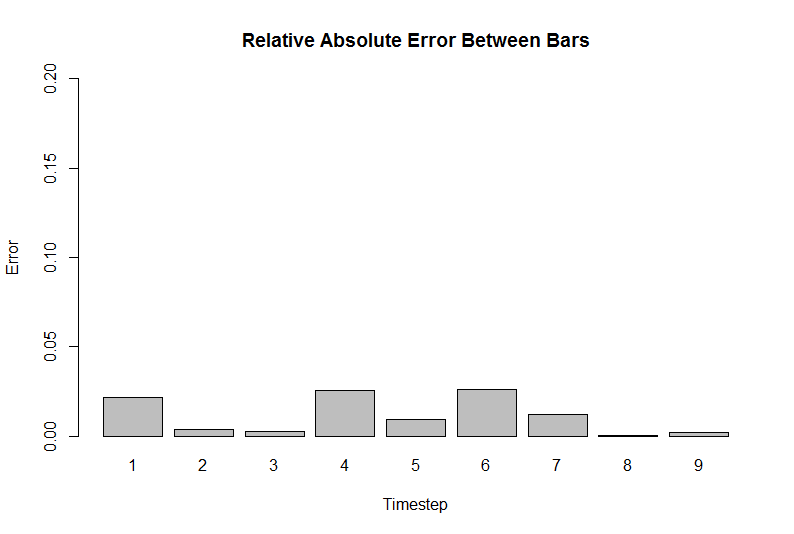
The 83rd percentile was arrived at experimentally by minimising the supremum norm of the relative error between the thresholded data and the raw data when they had been rescaled suitably.
Visualising the Epidemic:
Key:
Blue - Susceptible
Red - Infected
Green - Recovered