
Italy
Geographic and socioeconomic variation of sodium and potassium intake in Italy: results from the MINISAL-GIRCSI programme.
Francesco P Cappuccio, Chen Ji, Chiara Donfrancesco, Luigi Palmieri, Renato Ippolito, Diego Vanuzzo, Simona Giampaoli, Pasquale Strazzullo.
ABSTRACT
Objectives: To assess geographic and socioeconomic gradients in sodium and potassium intake in Italy.
Setting: Cross-sectional survey in Italy.
Participants: 3857 men and women, aged 39– 79 years, randomly sampled in 20 regions (as part of a National cardiovascular survey of 8714 men and women).
Primary outcome measures: Participants’ dietary sodium and potassium intakes were measured by 24 h urinary sodium and potassium excretions. 2 indicators measured socioeconomic status: education and occupation. Bayesian geoadditive models were used to assess spatial and socioeconomic patterns of sodium and potassium intakes accounting for sociodemographic, anthropometric and behavioural confounders.
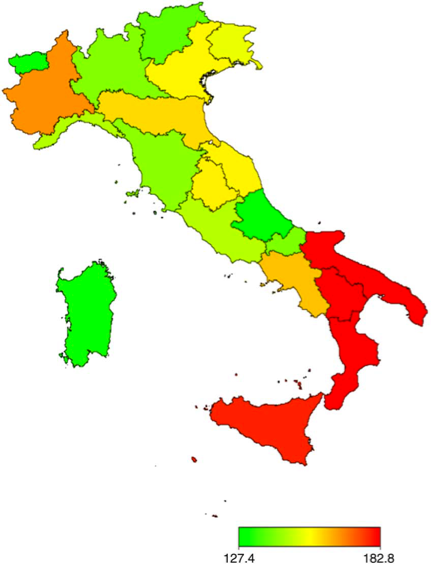
Results: There was a significant north-south pattern of sodium excretion in Italy. Participants living in southern Italy (eg, Calabria, Basilicata and Puglia >180 mmol/ 24 h) had a significantly higher sodium excretion than elsewhere (eg, Val d’Aosta and Trentino-Alto Adige <140 mmol/24 h; p<0.001). There was a linear association between occupation and sodium excretion (p<0.001). When compared with occupation I (top managerial), occupations III and IV had a 6.5% higher sodium excretion (coefficients: 0.054 (90% credible levels 0.014, 0.093) and 0.064 (0.024, 0.104), respectively). A similar relationship was found between educational attainment and sodium excretion (p<0.0001). When compared with those with a university degree, participants with primary and junior school education had a 5.9% higher urinary sodium (coefficients: 0.074 (0.031, 0.116) and 0.038 (0.001, 0.075), respectively). The socioeconomic gradient explained the spatial variation. Potassium excretion was higher in central regions and in some southern regions. Those in occupation V (low-skill workers) showed a 3% lower potassium excretion compared with those in occupation I. However, the socioeconomic gradient only partially explained the spatial variation.
Conclusions: Salt intake in Italy is significantly higher in less advantaged social groups. This gradient is independent of confounders and explains the geographical variation.
Excess dietary sodium and inadequate potassium intake in Italy: results of the MINISAL study.
Donfrancesco C, Ippolito R, Lo Noce C, Palmieri L, Iacone R, Russo O, Vanuzzo D, Galletti F, Galeone D, Giampaoli S, Strazzullo P.
Nutr Metab Cardiovasc Dis. 2013; 23(9): 850-856.
Abstract
OBJECTIVE. As excess sodium and inadequate potassium intake are causally related to hypertension and cardiovascular disease, the MINISAL-GIRCSI Program aimed to provide reliable estimates of dietary sodium and potassium intake in representative samples of the Italian population.
DESIGN AND METHODS. Random samples of adult population were collected from 12 Italian regions, including 1168 men and 1112 women aged 35-79 yrs. Electrolyte intake was estimated from 24 hour urine collections and creatinine was measured to estimate the accuracy of the collection. Anthropometric indices were measured with standardised procedures.
RESULTS. The average sodium excretion was 189 mmol (or 10.9 g of salt/day) among men and 147 mmol (or 8.5 g) among women (range 27-472 and 36-471 mmol, respectively). Ninety-seven % of men and 87% of women had a consumption higher than the WHO recommended target of 5g/day. The 24 h average potassium excretion was 63 and 55 mmol, respectively (range 17-171 and 20-126 mmol), 96% of men and 99% of women having an intake lower than 100 mmol/day (European and American guideline recommendation). The mean sodium/potassium ratio was 3.1 and 2.8 respectively, i.e. over threefold greater than the desirable level of 0.85. The highest sodium intake was observed in Southern regions. Sodium and potassium excretion were both progressively higher the higher the BMI (p < 0.0001).
CONCLUSIONS. These MINISAL preliminary results indicate that in all the Italian regions thus far surveyed dietary sodium intake was largely higher and potassium intake lower than the recommended intakes. They also highlight the critical association between overweight and excess salt intake.

Salt intake (g/day)* in Italy (2008-12)
| Mean | SD | |
| Men (n=1,114) | 11.6 | 4.4 |
| Women (n=1,098) | 9.0 | 3.7 |
| All (n=2,212) | 10.3 | 4.1 |
*adjusted for urinary Na as 95% of total Na intake
Method: 24h urine collection
Meno sale piú salute (National Campaign)
Salt content of commonly consumed food in Italy (2013-14)
National Campaign ('O sale mio)