Fully Electric Challenge - How do we make a car work?
How do we make a car work? - Designing power and Energy requirements activity
Activity Overview
Vehicles vary in speed, size, power, and energy. This exercise will give you an understanding in which parameters need to be known to calculate the speed and simulate the acceleration performance of real-world vehicles. You will use the parameters of current vehicles and see how changing the parameters affects performance.
One of the aims of the activity is to use the learning when deciding the requirements from your customer’s brief. Are you showcasing your EV as having the quickest 0-60 mph time on the market? Or do you just require a modest performance with sustainability & cost in mind?
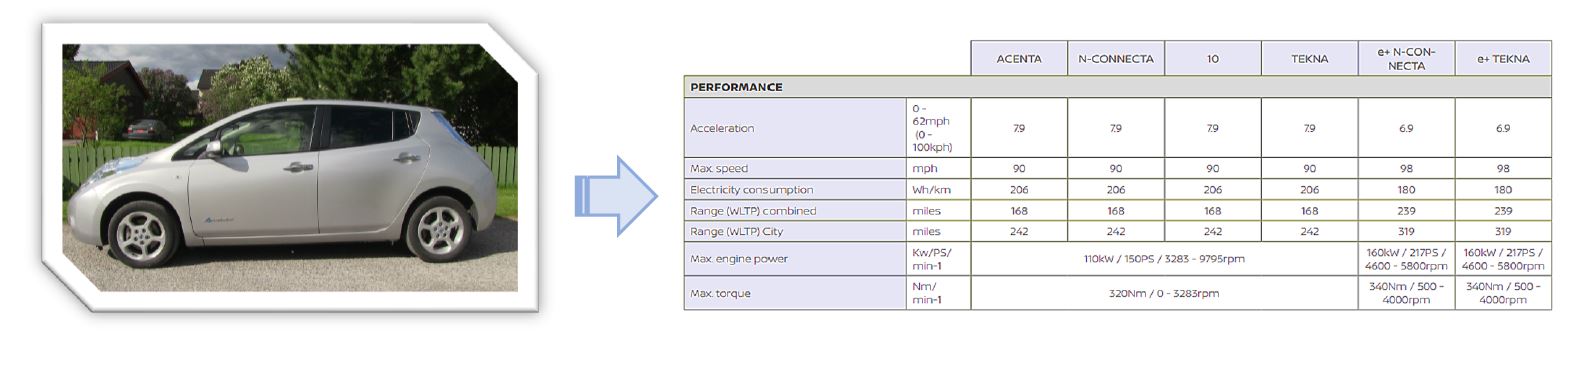
An example of the data is shown in Figure 1. This illustrates a datasheet taken from a Nissan Leaf Brochure, a very popular electric car. Engineers can simulate the theoretical performance parameters, such as max speed, power and range, from these values.
Challenge
In this activity, we are going to create a simulation that will calculate how fast your car can accelerate.
- To input equations into spreadsheet to generate a simulation and understand the forces that will act on the car
- Use the examples given to help determine what parameters you would like your car to have.
Equipment

Building the Simulation
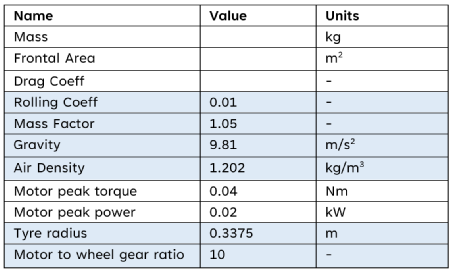
- In the constants tab there should be a table for the following constants. Calculate the total mass of your vehicle and add it to the first row in constants table. The value in grams will be converted into kilograms.
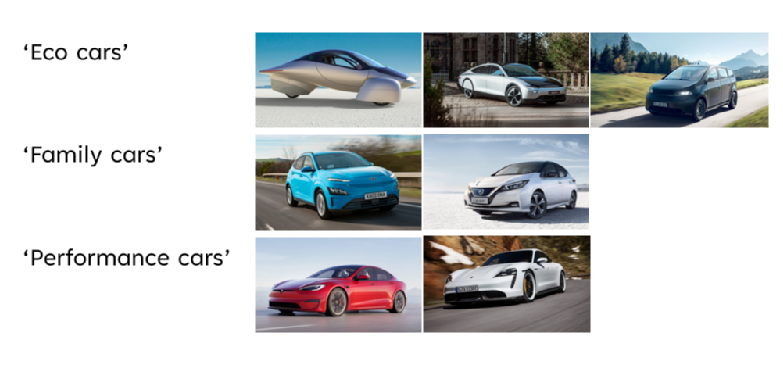
- The cars chosen for this exercise are:
Aptera Car – Eco car 1
Lightyear 1 Car – Eco car 2
Sono Sion – Eco Car 3
Hyundai Kona – Family Car 1
Nissan Leaf – Family Car 2
Tesla Model S – Performance Car 1
Porsche Taycan – Performance Car 2
- Select 1 of the 7 car names from the drop-down menu in cell E2. The parameters like the mass of the car, frontal area, drag coefficient, torque, power and the reported 0 – 100 km/h will appear. You can then use these values for the simulation. Input the values for mass, frontal area, the drag coefficient, motor peak torque and motor peak power into the table. This will save you time later.
Some values have been calculated for you and some are scientific constants, such as gravity, that will never change. For example, the frontal area for the prototype is assumed by measuring the height & width of the vehicle.
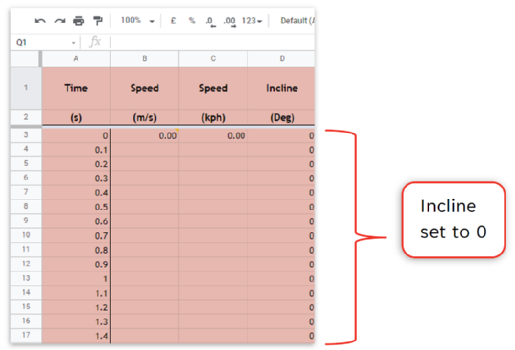
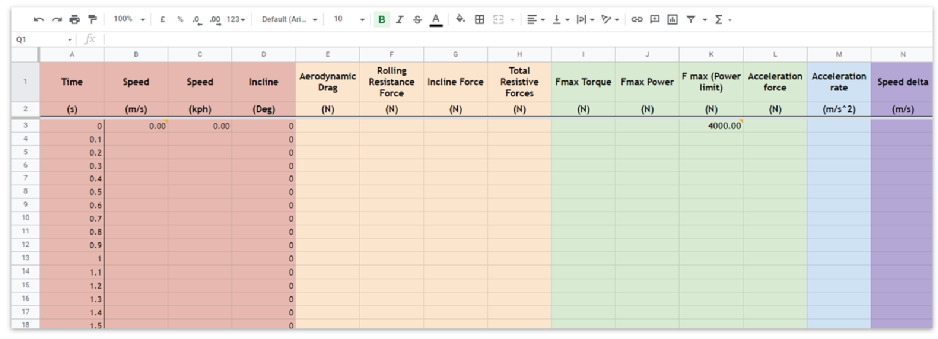
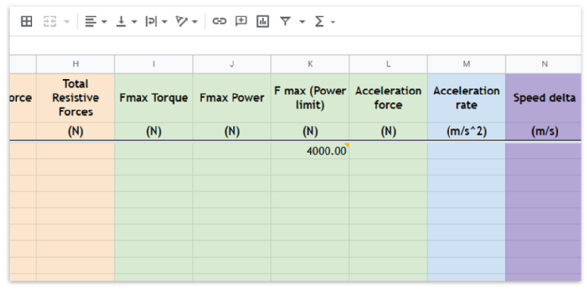
Open the acceleration tab in the spreadsheet, your spreadsheet should look like this!
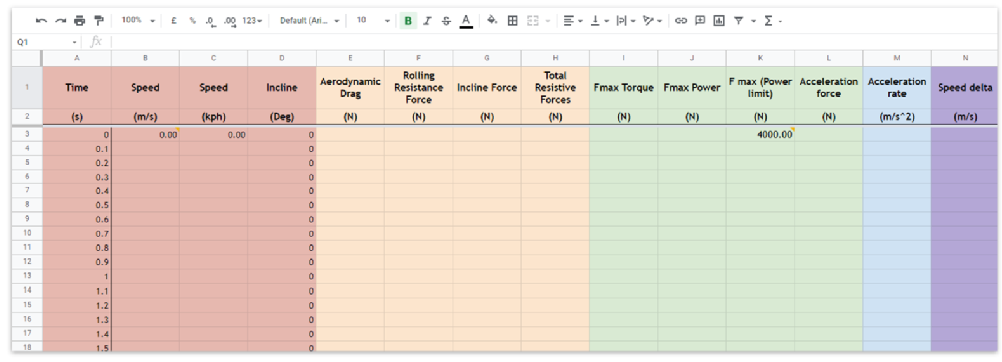
Now, we do not know the speeds as we do not know what force the vehicle will deliver and what acceleration rate it will achieve. The speed at the next point in time is the speed at the previous point plus the increase in speed from acceleration.
At time 0s, the speed in both m/s and kph should be 0. For the spreadsheet to work, the speed calculated in column B is the difference in speed at each time point and this is sourced from the value in column N (ΔSpeed) from the previous row. Hence, the ΔSpeed + Speed at ‘t-1’. Hint: t-1 is also t0 for the first calculation.
Ex 1: Write in cells B4 & C4 the current speed based on what we’ve explained. To convert from m/s to kph, multiply by 3.6.
The incline has been set to zero in all rows. You may want to change this later to trial if the car will work driving up a hill.
Now we need to add the equations for force and power. These are broken down into the following:
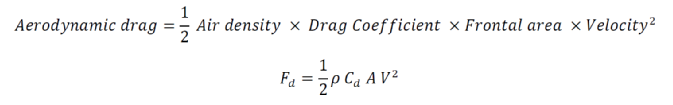
Aerodynamic drag force is dependent on the area and shape of the vehicle, the velocity of the car travelling, and the density of air the car is travelling through (there would be more drag driving through water, for example)
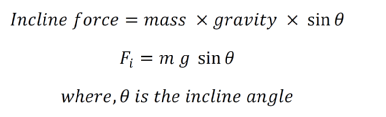
Incline force is the force taken to climb an incline. This calculation considers gravity and the angle at which the car is climbing.
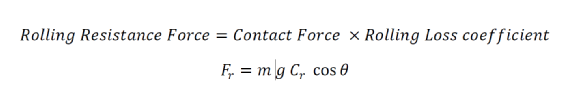
Rolling resistance force is the energy needed for the tyres to maintain movement at a consistent speed over a
surface, overcoming friction.
Total resistive forces is the sum of all 3!
Total Resistive Forces = Aerodynamic drag force + Incline force + Rolling resistance force
Hence, this the total force needed to just move the vehicle. Any extra generated force by the vehicle, the car will begin to accelerate.
Ex 2: Try and input these formulas into the spreadsheet! The first for air drag in cell E3 is:
=0.5*AirD*DragC*FrontalA*B3^2
Input the rest in cells F3, G3 & H3.
TOP TIP: As we are calculating the angle with tyres, you need to convert the angle from degrees to radians!
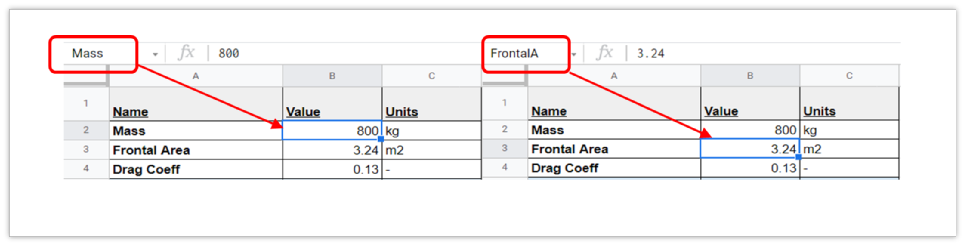
Note: that in the ‘Name Box’ in the top right (highlighted by the red box on the above images) we have name the cells for ease. This means you can input Mass rather than B2. This is particularly useful when, like in this activity, you are working across different worksheets as it saves you writing =Constants!B2 to reference other sheets!
Next, we must work out what force the vehicle’s motor can deliver. This is dependent on both the torque and power limit of the motor – the motor can only deliver the lower of these two limits.
The torque and power limits of the motor can normally be found on datasheets which are used to describe the product.
To calculate the maximum Torque limit of the motor you need to multiply the motor to gear ratio with the motor peak torque and divide it by the tyre radius.
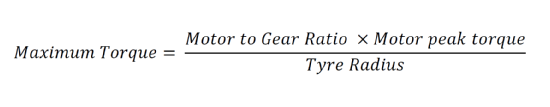
No doubt you have all heard of gears before. Well, the gear ratio is simply the conversion of the torque delivered by the motor and translated to the wheels. This is why we need the tyre (or wheel) radius as the force output delivered when the motor turns a wind turbine, for example, is going to different if the same motor was turning the wheel of a car!
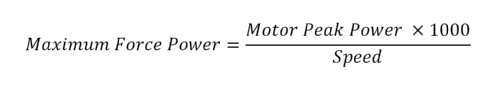
To calculate the maximum power limit of the motor, you need to multiply the motor peak power by 1000 and then divide by the total speed in m/s.
Ex 3: Can you input these torque & power equations into I3 & J3, respectively, similar to Ex 2?
To calculate the maximum force (K4 as we have set K3 as 4000 to get the spreadsheet to work), we can use the =IF() function to say if the maximum torque is less than the maximum power, the maximum force is determined by the maximum torque, otherwise it’s determined by the maximum force power.
IF(I4 < J4,I4,J4)
=IF(logical_expression, value_IF_true, value_IF_false)
This theory comes from the vehicle being either torque limited or power limited. Using an analogy to explain these concepts, you could have the world’s strongest man ready to push a wheel down a hill but if he doesn’t spin it that fast (aka - the rate at which he spins it), the wheel is not going to move anywhere anytime soon. This would be power limited where, Power = the rate of applying the torque (toque is just the force at the wheel) in a given amount of time.
TOP TIP: In cell K3, 4000 is a factor that enables the spreadsheet to generate the simulated acceleration curve – Do not change this cell! Input the formula in the cell below (K4).
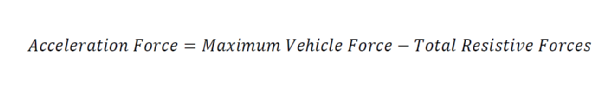
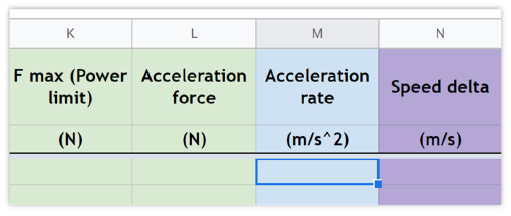
We now want to calculate the acceleration force. We assume that once all the resistive forces opposing the vehicle are subtracted from the maximum vehicle force, all that is left is force used for accelerating the car. This is the difference between the delivered force and the total loss forces (incline force, rolling resistance force, aerodynamic drag). To do this we minus the total force from the maximum force.
Ex 4: Can you input the given IF statement =IF(I4<J4,I4,J4) into cell K4 and the Acceleration force equation into cell L3?
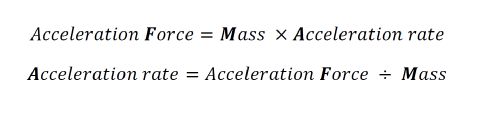
From the acceleration force we can calculate the acceleration rate using the F = ma formula and rearranging it!
In this instance we need to consider the mass factor for the simulation
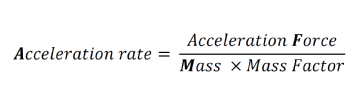
Note: You don’t need to worry too much about the mass factor. This is essentially a ‘fudge factor’ which accounts for the mass of the moving parts. To be precise, it is the rotational mass (aka inertia) of the components hence the distribution of weight radially affects this. For an analogy, it is akin to finding it more difficult to spin in a circle while holding some rope with a bowling ball on the end rather than holding the ball in your hands while spinning. The further the mass is from the rotational centre, the more rotational mass (aka inertia) it has. Maybe you can think why the solar motor is described as a low inertia motor?
Ex 5: Input the Acceleration rate equation into the cell M3, this should be the most familiar!
Now we know the acceleration rate, we can use this to calculate the total change in speed. Use the acceleration rate and multiply it by the difference in time (subtract the next time period from the current time period.
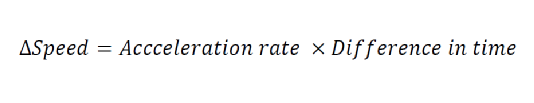
Ex 6: Input the final equation for the change in speed (Δ Speed) into the cell N3.
Once you’ve completed the formulas, double click on the square in the bottom right to fill down the cells with your formulas.
Once you’ve completed the formulas, double click on the square in the bottom right to fill down the cells with your formulas.
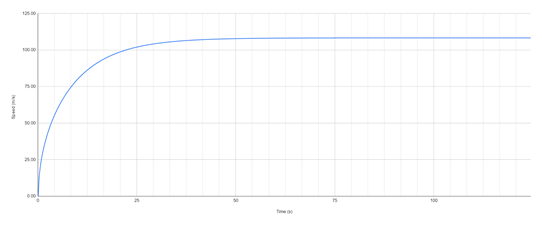
Open the tab ‘Acceleration (m/s) and you should see a profile like the one below – this is your simulation! There is another tab that plots the time against speed in kilometres per hour (kph).
Evaluation Questions
1. What is the importance of?
a. vehicle mass
b. Frontal area or aerodynamic drag
2. How will driving up a hill affect the car?
3. What are the pros and cons of driving an electric vehicle?
4. How could the simulation be improved?
i.e.
- improve estimation of frontal area
- Try and compare with different motors