
MIR@W Day - Data Visualisation
MIR@W Day - Data Visualisation and Story Telling
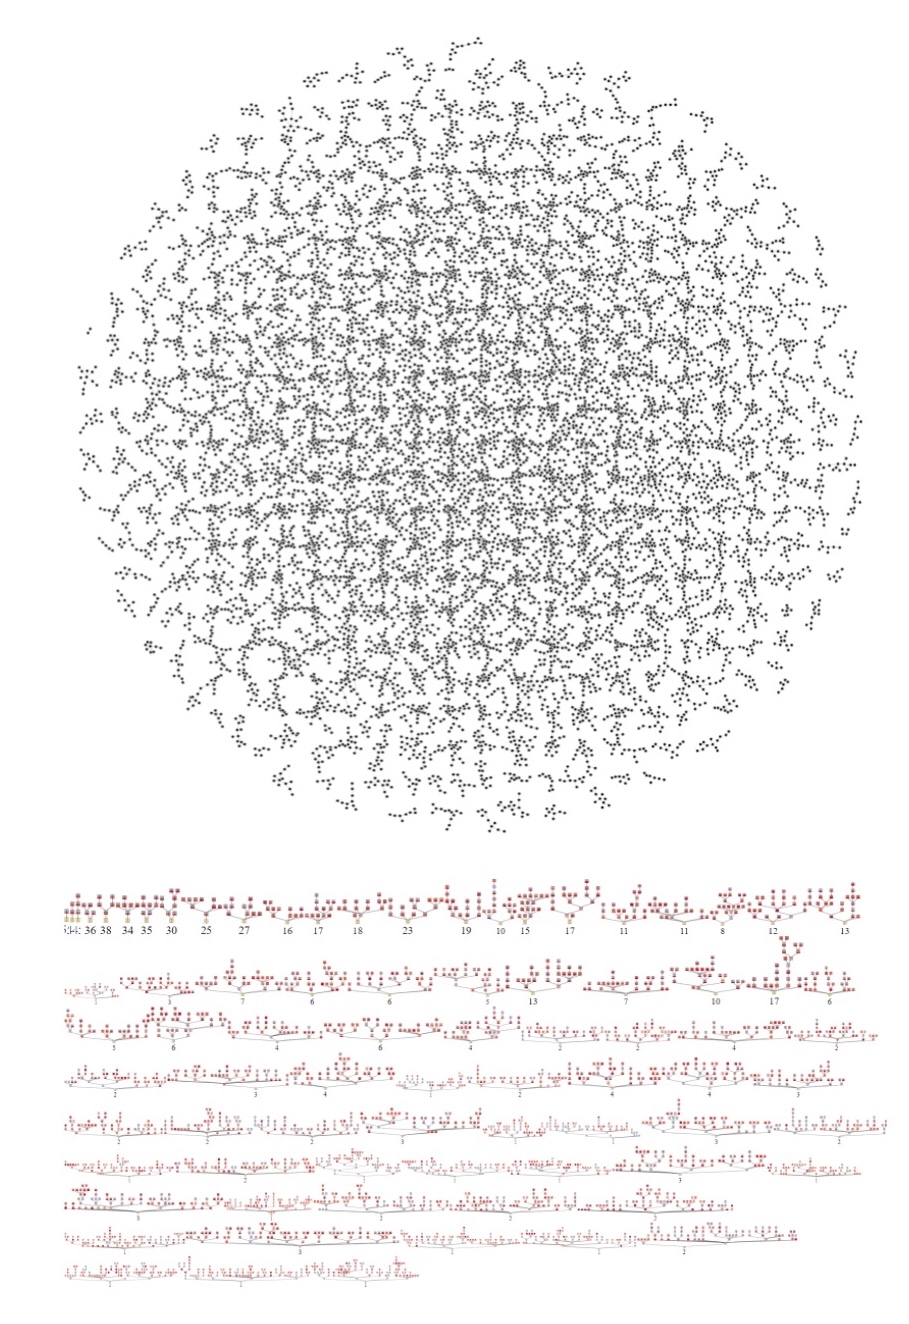
Novel technologies in engineering, medicine, science, and the social sciences generate complex longitudinal and multivariate datasets, making effective data visualisation essential for analysis, communicating key insights and building a dialogue with the audiences to establish understanding and trust in measurements and underlying systems.
Modern approaches build on foundational work by pioneers such as Charles Minard and Jacques Bertin as well as visual data analysis methods by John Tukey, while integrating advances in visual communication, computational design, statistical modelling, and methods such as topological data analysis. These approaches support the systematic assessment of complex data, identification of structural issues, and the generation of reliable, high-fidelity representations for decision-making.
We join forces with CIMLink opens in a new window to offer an event on advances in data visualisation in data-intensive science and the design of effective narratives for rich, audience-aware communication. Following an introduction to key concepts and approaches, we will focus on how to identify visualisation aims and needs before experimenting with alternative ways of putting them into practice. This event centres on graphical methods, the design process and the stories they can tell, rather than on specific coding techniques, making it accessible to participants from a wide range of backgrounds.
Organiser: Julia Brettschneider - Julia.Brettschneider@warwick.ac.uk and Cagatay Turkay - Cagatay.Turkay@warwick.ac.uk
Date: Wednesday 30.9.2029
Location: Zeeman building room D1.07 (directions)
Registration form: Click here to register.
Who should attend? We aim to bring together researchers across campus to foster collaboration. We particularly invite early-career researchers and PhD students for this opportunity. No prior knowledge of software or computing languages or is expected.
Programme
| 1:00-1:30pm | Lunch & welcome |
| 1:30-2:30pm | Introductory talks by Roger Beecham (Associate Professor in Visual Data Science, University of Leeds) and Kevin Allain (CIM, Warwick) about communicating data through visual and narrative techniques |
| 2:30-2:45pm | Short networking break |
| 2:45-4:15pm | Interactive workshop: Explore, Model, Tell |
Talk titles and abstracts:
Data Visualisation: From Communication to Analysis
by Roger BeechamLink opens in a new window, Associate Professor in Visual Data Science, University of Leeds
Bio: Roger Beecham is Associate Professor in Social Data Science at the School of Geography, University of Leeds and Director of Research & Innovation at Leeds Institute for Data Analytics. Roger’s work proposes, tests and applies visual methods that help analysts to understand and communicate complex (spatial) processes under uncertainty. He’s especially interested in how visualization relates to contemporary data analysis, and can be applied to help analysts and policymakers make better decisions.
Supporting Decision Making through Interactive Visual Methods: A case study in public health decision making
by Kevin AllainLink opens in a new window, CIM, University of Warwick
Bio: Kevin Allain is a postdoctoral researcher at the Centre for Interdisciplinary Methodologies at University of Warwick. His work and academic interests are positioned at the intersection between information design and computer science. He currently works on the HAT MEPP projectLink opens in a new window.
Join (in person): Please register above.
Join (online-Microsoft Teams): This is an in-person event.
Outcomes: You will gain clarity on your data communication requirements and see effective visualisation and narrative techniques in action.