
Physics Department News
New paper published in Space Weather
New paper published in the AGU journal Space Weather by PhD student Martin Cafolla with colleagues from the Centre for Space Fusion and Astrophysics (CFSA) and the Jet Propulsion Laboratory (JPL).
The research was conducted primarily within CFSA as part of Martin’s PhD project, which is funded by the Air Force Office for Scientific Research (AFOSR).
The ionosphere is a portion of the upper atmosphere of the Earth consisting of free electrons and ions as a result of exposure to solar radiation. The variability of intensity of this radiation, as well as the differing levels of geomagnetic activity, results in fluctuations in electron number density across the ionosphere, characterised by the Total Electron Content (TEC). Analysis of how TEC structures change over time can help mitigate the potential risks extreme space weather events pose on navigation and communication systems such as GPS.
Using 20 years of global ionospheric maps provided by JPL, the group used image processing tools to isolate, detect and track the top 1% of TEC measurements in sun-centred coordinates to define High Density Regions (HDRs) of TEC. A statistical study was conducted to determine reproducible trends in HDR formation location, trajectories and durations for different levels of geomagnetic activity at continental and sub-continental (small) scales. They found that HDR formation is primarily driven by the sub-solar point, spanning the afternoon ionosphere, and in general occurs around four magnetic latitude clusters. Small HDRs typically move along lines of constant magnetic latitude in the direction of Earth rotation, while continental scale HDRs follow much more complex paths. The statistical nature of these results provides a probabilistic prediction on future HDR behaviour, offering an ensemble constraint on enhancements seen in ionospheric models.
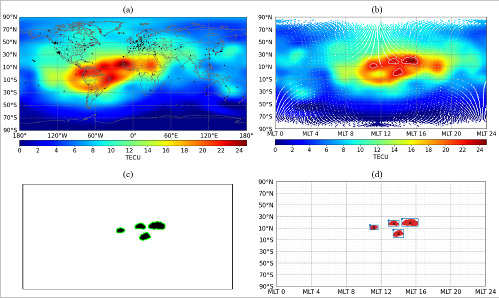
Figure (a) shows an example global ionospheric TEC map in geographic coordinates, with black triangles marking the distribution of ground stations available. Figure (b) plots the same map in geomagnetic coordinates, with grey contours outlining the top 1% of TEC measurements. Figure (c) extracts these measurements and plots them in black, with green lines to demonstrate the detection algorithm for HDRs. Finally Figure (d) plots the isolated HDRs in SM coordinates with bounding rectangles in blue and centroids marked in black, obtained by the detection/tracking algorithm.
Find out more about the project by reading the publication: https://doi.org/10.1029/2024SW004307