
SH Ultrasound - What?
How is thickness measurement performed?
Thickness measurement is a common NDT application, but usually requires prior calibration to obtain the wave speeds in the sample. This is a problem if the calibration cannot be performed, or if the wave speeds vary due to texture, temperature, or stress.
An automated thickness measurement technique for flat plates has been created, with the majority of the testing being on aluminium and stainless steel plates from 0.5mm thick to 5mm thick. The technique does not require knowledge of the characteristics of the sample, relying on the phase speed measurement of two SH wave modes, and hence is a calibration-less technique.
The technique uses a static emitting EMAT, and a receiving EMAT placed along the propagation direction of the emitting EMAT. The emission frequencies of the SH0 and SH1 mode are obtained, either using something like a chirp, or simply performing a frequency sweep, and after that, the appropriate single frequency (with a large number of cycles in a pulse) is used to generate one of the modes. Data is collected at that position for both SH0 and SH1 modes, and then the receiving EMAT is moved along the propagation direction by a few millimetres, and data collected again. A speed measurement is taken of the SH0 and SH1 modes; this is easy for the SH0 which is dispersionless (the pulse does not change shape as it propagates), and relatively easy for the SH1, since the large phase speed and long pulse of the SH1 mode means that a oscillation peak moves very little in time due to the small positional change.
Once the SH0 and SH1 phase speeds have been obtained, a simple rearrangement of the dispersion equation, inserting these quantities, gives the sample thickness.
How are SH waves used to find and quantify defects?
SH waves are being investigated for their use in finding and quantifying defects in a range of different testing conditions.
In thin plates, SH waves behave as guided waves. By using separate emitting and receiving EMATs, a region can be scanned by moving the EMATs as a pair. Through thickness defects are very easy to spot, with reflections from 1mm circular holes being easily detectable. More challenging are short and shallow defects. Work is currently progressing on identifying and quantifying these defects; it is necessary to use more than a single wave mode, due to the difference in sensitivity to defects between the modes. It is certainly not possible to perform these measurements in a transmission mode, as the attenuation of the signal for shorter defects is insufficient, even if they extend through the entire thickness.
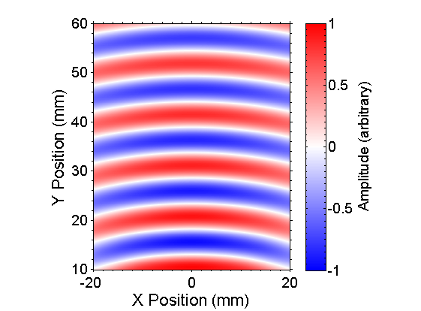
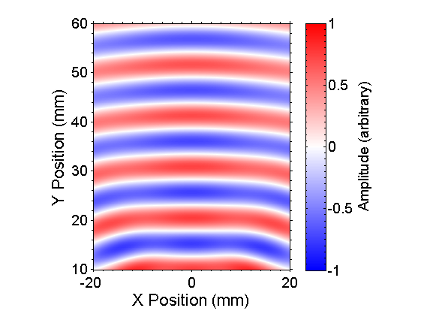
These figures depict a 300kHz wave from a 2cm wide EMAT, without (left) and with (right) a 3mm through thickness slot directly 50mm in front of the EMAT. The region shown is the area 10mm to 60mm after the defect. Very little change can be observed, meaning that detection using transmission would be extremely difficult, and reflection must be used instead.
SH waves are also being used to find defects in welds, with samples under consideration having thickness from 20mm to 600mm. Depending on the separation between the EMATs and the defect, and the thickness of the sample, the wave can either behave as a guided wave or as a bulk wave. At the current time, defects are being found by performing a D-scan along the weld region. Additional signals indicate the presence of a defect. For the thicker samples, the generation frequency is used to aim the ultrasound at the correct position, and in addition, the frequency of the scattered ultrasound gives information on the defect depth.
Can SH waves operate on complicated structures?
SH waves have been found to travel around curved sections of the sample (propagation medium) with only small amounts of reflection, and this has been explored using simulations and experiment. In order to determine the extent of the reflection, FEM simulations were created to model a series of curved sections, with a range of angles and radii of curvature. Taking the peak-to-peak amplitudes for each simulation provided an easy way to compare the reflected signals observed. To understand the results, a simple analytic model was also constructed, in which each section of the curve reflects the same amount. The overall signal received is then a combination of all the contributions from each part of the curve. This simple analytic model does not give the amplitude actually seen, merely the amplitude as a fraction of what would be seen for the zero delay (infinite speed) case, for which all the reflected waves would add coherently.
 "ePortfolio - Phil Petcher" by Phillip A. Petcher is licensed under a Creative Commons Attribution 3.0 Unported License.