
Journal Club Week 2
Follow us on twitter for updates and helpful hints! @physics_journal
B. P. Abbott et al (LIGO Scientific Collaboration and Virgo Collaboration) (2016). Observation of Gravitational Waves from a Binary Black Hole Merger. Physical Review Letters, Vol. 116, No. 061102
Summaries and answers now available
The LIGO (Laser Interferometer Gravitational-Wave Observatory) experiment was built between 1994 and 2002 to test the principle that gravitational waves could be detected experimentally. After a significant upgrade in 2010 to become one of the most sensitive pieces of scientific equipment ever created. Just two days after the upgrade was completed, in September 2015, LIGO had detected gravitational waves. After much checking, the rear 1000 researchers from all over the world published their research in February 2016.
The paper can be found at https://journals.aps.org/prl/abstract/10.1103/PhysRevLett.116.061102 (once there, click either of the green buttons for PDF or HTML views). This article does also have a summary of its findings in slightly simpler terms if you need some clarification. It can be found here. As a bonus, at the very bottom of the page we have an extension set by our very own Professor Andrew Levan.
This paper might seem tricky and you might think, at times, that this is a little difficult. But, remember, these papers are written for a scientific audience, so even if you only fully understand a fraction of the paper, that is a considerable achievement. Below are some questions to help focus your thinking when reading the article - they should hopefully steer you to a better understanding. You can also download the Cornell notes template for this paper (which includes the same questions) as a Word Document or PDF. Teachers, feel free to download this and forward it on to your students.
Note, we AREN’T going to read this paper in order. We’re going to read it the sections in the following order ABSTRACT, INTRODUCTION, DETECTORS, DETECTOR VALIDATION, OBSERVATION, SEARCHES, SOURCE DISCUSSION, OUTLOOK, CONCLUSION
A 16-page paper seems, at first, quite intimidating. But this is no normal paper. Almost half of its pages are dedicated to acknowledging the work of the huge number of scientists from all over the globe that were involved in the research. That being said, the author list for this paper, as seen on page one, seems to be just one person: B. P. Abbott. This is not the case. Et al. is an abbreviation of the Latin phrase et alia which translates as and others. In fields of science where there are a significant number of contributors (such as the Large Hadron Collider or LIGO, for instance), journals save some space at the start of the article by presenting a smaller number of authors. On p.11, after the references, the true author list is presented. Alongside each author is a superscript number and these tally with the long list of academic institutions which follow the author list. There are around 1000 authors on this paper, working at 133 different institutions (with some authors having multiple affiliations), so this is truly a global achievement. You’ll also note that three of the authors sadly passed away during the process of researching, analysing, and writing the paper, showing in some way how much time it takes to produce such a significant piece of research. This article highlights that meticulous planning wasn’t just a part of the research and data collection, but part of the publishing process too:
After the title and authors, this paper begins with an abstract. An abstract is a short summary of the work you’re about to read, giving the main findings and their implications. When reading a paper, especially if you’re looking over a significant quantity of literature at the beginning of a new project, you might use the abstract as a guide to whether or not the piece of research is useful for you to read. This abstract is eight sentences long and we’ll look at each one in turn.
Sentence 1: The authors bluntly state what this paper is about: an observation of gravitational waves.
Sentence 2: They discuss the features of the signal that they have measured – a wave which has increasing frequency and they discuss how large the signal becomes.
Sentence 3: They say how it matches predictions from simulations. This is crucial. The whole reason LIGO was created and over $1billion was spent on the project was to test the predictions of the General Theory of Relativity. Here, the authors are stating that their signal matches Albert Einstein’s predictions from the early 1900’s.
Sentence 4: They discuss how statistically significant their results are. A five sigma (5σ) effect is the benchmark for a discovery in many fields. It means there’s only a one in 3.5million chance of such a signal occurring within their data from a source that was not a gravitational wave. For a nice blog on the 5σ effect, see https://blogs.scientificamerican.com/observations/five-sigmawhats-that/
Sentence 5: This gives details about the astronomical event that is believed to be the source of the gravitational waves, two black holes of similar sizes colliding around 410 million Parsecs away (A parsec is 3.26 light years https://en.wikipedia.org/wiki/Parsec) to form a larger black hole.
Sentence 6: This gives details on the error bars that are presented in the previous sentence.
Sentence 7: This sentence explains why the research is significant within the field of astrophysics, astronomy and cosmology.
Sentence 8: This sentence explains the wider importance of the work.
INTRODUCTION (Some of these videos may be useful for this section. A 5min introduction by the scientists involved: https://www.youtube.com/watch?v=B4XzLDM3Py8 A very simple visual explanation of gravitational waves by Amber Stuver: https://www.youtube.com/watch?v=hebGhsNsjG0 A demonstration of gravitational waves by Steve Mould: https://www.youtube.com/watch?v=dw7U3BYMs4U)
- (P1, C1) The ‘linearized weak-field equations’ are simplified versions of the equations from Einstein’s General Theory of Relativity. These equations, amongst other things, describe the working of gravity, space and time. What are some of the solutions (objects or events within the universe) that scientists have found for these equations?
- (P1, C1) Why should we strictly refer to Einstein’s work as the ‘General Theory of Relativity’ and not the ‘Theory of General Relativity’?
- (P1, C1) What is a black hole? And what is a black hole merger?
- (P1, C1) Gravitational waves can be described as ‘transverse waves of spatial strain’ - what does this mean?
- (P1, C1) How have black holes been detected previously?
- (P1, C2) Given that Hulse, Taylor and Weisberg have shown the existence of gravitational waves from their analysis of a binary pulsar system (binary means two, a pulsar is a spinning neutron star that emits electromagnetic radiation from its poles), why are the findings of this paper considered to be ground-breaking? (This link gives some detail on the Hulse-Taylor binary that won them a Nobel prize https://en.wikipedia.org/wiki/Hulse–Taylor_binary)
- (P1, C2) What are some of the detectors that have previously hunted for gravitational waves unsuccessfully?
- (P1, C2) What characteristic makes Advanced LIGO (which is the improved version of LIGO) the only detector to have directly seen gravitational waves?
- (P1, C2 and P2, C1) Why are ‘highly disturbed black holes’ such vital objects for testing the predictions of the General Theory of Relativity?
DETECTORS (You might find some helpful additional information at https://www.ligo.caltech.edu/page/ligos-ifo for this section)
- (P3, C1) Why do they need multiple detectors that are widely separated?
- (P3, C1) Give an example of the type of environmental noise that can be isolated by having detectors separated by large distances?
- (P3, C1&C2) Each Advanced LIGO experiment consists of “a modified Michelson interferometer that measures gravitational-wave strain as a difference in length of its orthogonal arms”. Using the diagram in Figure 3, explain this in simple terms.
- (P3, C2) When a gravitational wave passes through the equipment, what does it do to the arms? How does Advanced LIGO notice such a difference?
- (P3, C2) Advanced LIGO gives its measurements in terms of strain (which LIGO give the symbol, h), which is defined as the change in length (ΔL) divided by the total length (L). So the equation is h=ΔL÷L. Why is strain unitless?
- (P3, C2) Using the equation from strain (h=ΔL÷L), if the total length of one of the arms is 4 km, and the maximum strain measured by Advanced LIGO (according to the abstract) is 1.0×10⁻²¹, then what is the maximum change in the length of one of the arms?
- (P3, C2) Advanced LIGO is not a basic Michelson interferometer, what have they done to enhance the signal?
- (P4, C1) The laser that they use is ‘a 1064-nm wavelength Nd:YAG laser, stabilized in amplitude, frequency, and beam geometry’. In what region of the electromagnetic spectrum is the laser and why does it need to be stabilised?
- (P4, C1&C2 and P5, C1) What are some of the ways in which the equipment has been built so as to minimise vibrations that would alter the positions of the mirrors?
- (P4, C1&C2 and P5, C1) What are some of the ways in which the equipment has been built so as to monitor vibrations that would alter the positions of the mirrors?
- (P5, C1) One of the key aspects of Advanced LIGO is having the two sites at opposite sides of the United States (see Figure 3a). It takes light 10 ms to travel directly between these sites (and as gravitational waves travel at the speed of light as well, this is true of gravitational waves too). Advanced LIGO is therefore looking for a similar signal at both sites but shifted in time by a small amount. How do they ensure their timings are accurate to know that any gravitational wave has travelled at the speed of light between the two stations?
- (P4) Figure 3(b) shows a graph of the noise experienced at each of the Advanced LIGO sites around the time of the detection. Discuss what you see in this graph (remember that is uses log scales).
DETECTOR VALIDATION
- (P5, C1&2) This section discusses the checks they performed to ensure their signal wasn’t spurious. Given that the answer is “no, we didn’t find anything”, why is such a section necessary?
We now go backwards in the paper to the section on OBSERVATION
III. OBSERVATION
- (P2, Figure 1) Looking at the top left panel of the figure (the observed Hanford, Washington signal), describe the signal (you may find it useful to look at the panel beneath it too – a simulation of a gravitational wave event that they believe would match their signal).
- (P2, Figure 1) In the top right panel, they show the data from the Livington, Louisiana site with the Hanford, Washington data added to it but shifted and inverted. It is rare in science to simply shift and invert your data to show that they agree. Reading the caption, why is it necessary to perform this shift and inversion (and in fact also an important sanity check on their results)?
- (P2, Figure 1) In the third row of the Figure, we see the residuals. These are the result of subtracting the simulated data (the data in the second row) from the real data (the data in the top row). These residuals seem to show nothing but noise, why is this a good thing?
- (P3, C1) Other than to distinguish between signal and noise, why else do they have two detectors on opposite sides of the country?
- (P3, C1) What general method do researchers use to understand what astronomical objects are the cause of the gravitational waves?
- (P3, C1) Why does the emission of gravitational waves cause two black holes to orbit closer?
- (P3, C1) Why can the signal not be due to two neutron stars colliding?
- (P3, C1) Why can the signal not be due to a neutron star and a black hole colliding?
- (P3, C1) Why can the signal not be due to other astronomical objects colliding?
- (P3, Figure 2) At the top of the panel, there are 4 diagrams. Describe what is happening in these diagrams and how it relates to the numerical simulation of the strain (the red line).
- (P3, C1) Looking at the equation for the chirp mass, validate that units remain kg in each part (the f with a dot above it is the time derivative of frequency and so has units of s-2).
Now we move to section V. SEARCHES
V. SEARCHES
This section of the paper is a little more technical as it provides further evidence to validate the claims made so far. It may be that less of this section makes sense, and that is to be expected. But we can still aim to understand the general idea of this section.
Here, scientists are aiming to present evidence that the detected signal is from a black hole merger (with a strong statistical significance) rather than from the next most probable other cause: experimental noise. Another way of putting it is to say that the researchers want to estimate if such a signal could be spurious/produced by chance – they do this by looking at the LIGO signal at other times and working out how likely it is that the signal is real.
“We present the analysis of 16 days of coincident observations between the two LIGO detectors from September 12 to October 20, 2015.” The gravitational wave detection occurred on September 14th, 2015.
Let’s start by imagining we had just one single Advanced LIGO detector and, for over a month, they’re constantly measuring the strain (the change in length of the arms). They have reams and reams of data, detailing the strain at every instant in time. The measured strain will never be zero, because their measurements are so precise that they pick up changes to the length of the arms that can occur for any random reason (vibrations in the ground due to cars travelling down the road, thermal fluctuations, burrowing animals etc.). They call these background events. So, when searching through all of the data, it would be very difficult to tell apart a strain signal caused by gravitational wave from one caused by the background events.
But, it’s okay, because they actually have two detectors that are separated by a huge distance (a distance which takes light 10ms to travel in a straight line). So, the search is actually for coincident strain events - events that occurs at the same time (technically, within a 10ms window to account for the travel time) - between the two stations.
But even with this additional requirement of coincidental signals, they have so much data that due to the random nature of measurements, and the law of large numbers, you’d always expect to find some coincident data just by chance.
These searches, then, are occurring within the data collected by LIGO over this period of just over a month in September and October 2015 to ascertain what might be signal, and what is just coincidental noise.
The first paragraph within the generic transient search section says: “Designed to operate without a specific waveform model, this search identifies coincident excess power in time-frequency representations of the detector strain data, for signal frequencies up to 1 kHz and durations up to a few seconds.”
Splitting this up a bit at a time:
- “Designed to operate without a specific waveform model” - they are searching their data without making assumptions above what shape a gravitational wave signal will have. They know what a signal of two black holes would look like but want to be sure that the data they found on September 14th is significant, regardless of what shape it takes.
- “this search identifies coincident excess power in time-frequency representations of the detector strain data” - they are looking for significant changes in the strain that are coincident (in this case meaning within the 10ms travel time) between the two sites.
- “for signal frequencies up to 1 kHz and durations up to a few seconds” - they have some limits within this search to keep the frequency below 1kHz and they’re looking for changes in strain that last for a few seconds
They search their data according to a detection statistic given as

Ec is a value that quantifies the strength of a signal and En quantifies the amount of noise.
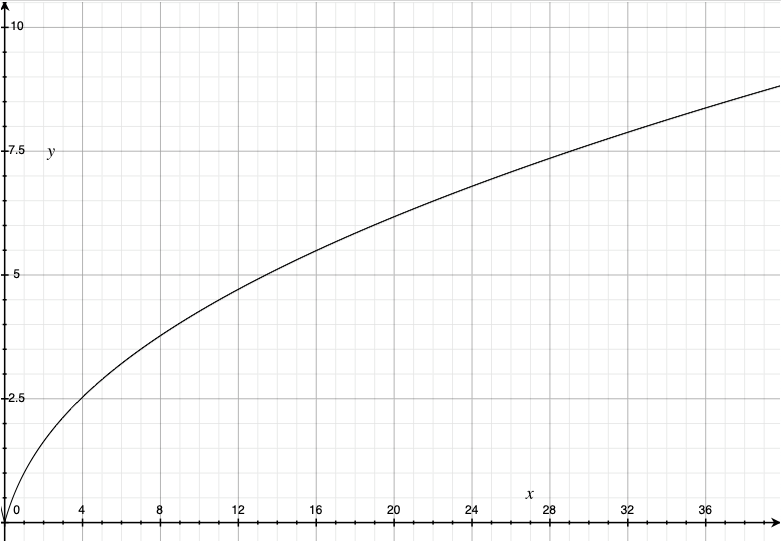
On the following graph, I plot the detection statistic, ηc on the y axis and the signal strength quantifier Ec on the x axis (assuming the noise quantifier En is constant). We see that as the signal strength increases, the statistical significance increases, which is what we’d hope.
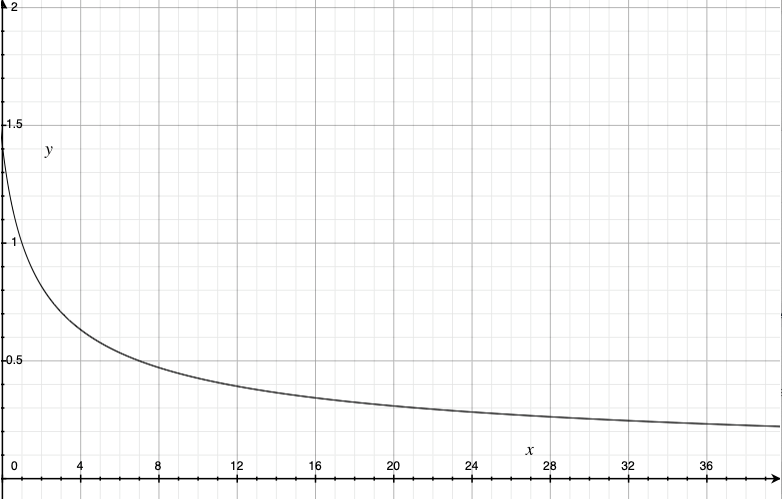
On the following graph, I plot the detection statistic, ηc on the y axis and the noise strength quantifier En on the x axis (assuming the signal quantifier Ec is constant). We see that as the noise strength increases, the statistical significance decreases, which is what we’d hope.
In their search they find that this event is very statistically significant. Using two separate searches they quantify that the chance of seeing a signal like this by chance (the false alarm rate) is lower than 1 in 22 500 years in one search and around 1 in 8 400 years in another.
The binary coalescence search is different as it asks, if we assume the signal is from a binary merger (binary meaning two, so two objects merging together) then what sort of merger is the most likely? They take simulated models, using the General Theory of Relativity and model what different sized mergers of different objects would look like. They then compare these to the observed data and see how well they match up. They do a statistical test, called a chi-squared test which quantifies how well the modelled data fits the observed data. From this, the best-fit model shows two black holes merging, one around 36 solar masses, and one around 29 solar masses. They merge to form a black hole around 62 solar masses. Their models give error bars to all of these values.
We’ll have fewer questions for this section:
- (P5-P7) We don’t know beforehand when a gravitational wave event is going to happen. How does this affect the way in which we attempt to measure such events?
- (P6, Figure) What would you say is the key message to understand from this figure about the event GW150914?
- (P7, C1) Why is the mass of the merged black hole less than the mass of the two initial black holes combined?
SUMMARY QUESTIONS
- What makes this such a ground-breaking paper?
- Without relying on the abstract/conclusion, how would you summarise what you have understood about this paper in one paragraph?
- If you had to explain why someone should read this paper in one sentence, what would you say?
- Do you have any criticisms of this paper?
OPTIONAL EXTRA
Professor Andrew Levan has written an amazing worksheet to teach you how to perform calculations in the programming language, Python. You’ll be initially calculating gravitational forces and then applying this to the study of gravitational waves from compact binary systems. You could perform these calculations on an online Python emulator such as this.
GENERAL INFORMATION
Remember, reading a paper isn't like reading a piece of fiction or a newspaper article. Don't get frustrated if it doesn't immediately make sense - you might need to do a little research of your own to understand some of the ideas. This article gives you an idea of how scientists read differently.
Each question refers to a specific part of the paper e.g. Page 2, Column 3 is written as (P2, C3).
Next week, we'll publish solutions to the questions and the best submitted summaries from students across the country.
NEXT WEEK
We're going to be looking at what some scientists are getting up to in isolation at home with a group trying to solve the puzzle of room temperature superconductivity. As a bit of background, you could watch this summary of why superconductors might be useful to us. This page outlines some of the history of superconductivity (with lots of links throughout and down the sidebar) and highlights some of the research being undertaken within our University.