
LineageTracker Tutorial
Installation
To install LineageTracker, drag the 'jar' file into the ImageJ or Fiji window. A dialog box should appear; clicking 'Save' should save the file into the 'Plugins' directory. Alternatively the file can be manually copied into the plugins folder, which will be located wherever ImageJ of Fiji was previously installled. Any older versions of the LineageTracker jar file should be removed first.
System Requirements
LineageTracker requires ImageJ version 1.44o or later, and Java v1.6 or later. Image5D is also required. Fiji is recommended since it already includes Image5D and many other additional plugins or commands.
Installing Plugins
Plugins contained within a 'jar' file can be installed in the same manner as above.
Running LineageTracker
LineageTracker is installed into the Plugins menu:
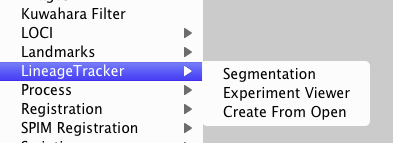
The three options are:
- Segmentation : Create or Load an experiment and perform image segmentation
- Experiment Viewer : View and edit the tracking or segmentation, or export results
- Create From Open : Create a new experiment based on the currently open images.
Creating a new experiment
The 'Segmentation' option allows a new experiment to be created and edited. Each experiment is a self-contained directory which is held within the 'Root' directory (shown as the 'data' directory below)
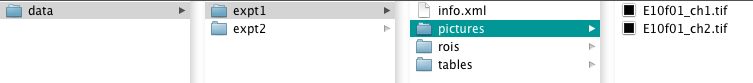
Selecting a new experiment creates the directory structure in the root directory and prompts for image files to add. Such image files need to be in 'TIFF' format.
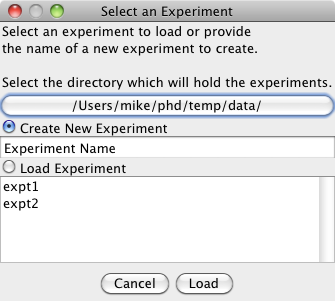
To create a new experiment, type the name in the text area. To edit an existing experiement, select the experiment from the list. If a new experiment is selected the dialog box below appears to add image channels.
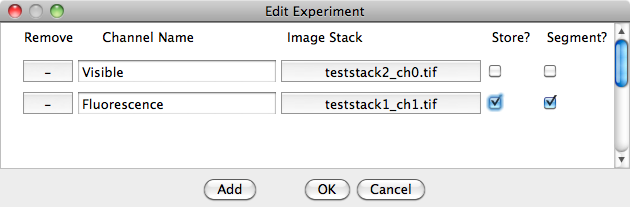
To add image channels, click on 'Add' then click on the box in the 'Image Stack' column to select the 'TIFF' stack. The 'Store' and 'Segment' tick boxes select whether the given image is passed to the segmentation method and whether the the pixel intensity is measured for the channel.
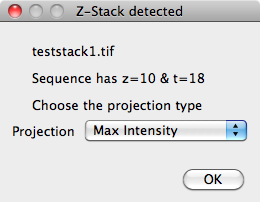
If the image files are not in TIFF format, the images will need to be loaded into ImageJ then 'Create From Open' needs to be selected from the ImageJ Plugins menu. An experiment name needs to be selected, as above, then all the open images will be added. Any xyzt stacks or hyperstacks will be detected and prompted for conversion into xyt:
Segmentation and Tracking
The main Segmentation window gives access to segmentation methods and experiment data.
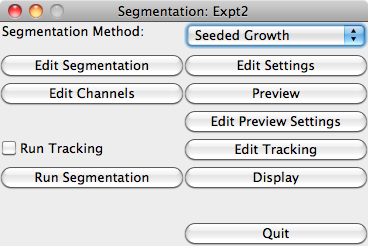
The 'Segmentation Method' list allows choice between the built-in methods and any segmentation plugins which have been installed. 'Edit Segmentation' opens up a dialog box to change any parameters used by the chosen segmentation method, for example the 'Seeded Growth' method has the following settings:
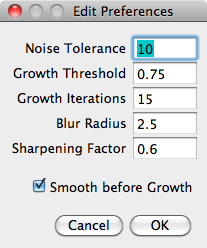 Noise Tolerance: Intensity of a peak before it is detected by the ImageJ 'Find Maxima' method.
Growth Threshold: Smaller values allow lower intensity pixels during the 'growth' of the cell. Values are between 0-1.0
Growth Iterations: The number of passes of the 'grow' method. Sets the maximum size which will be created by the method.
Blur Radius: The size of the gaussian kernel applied to the image before the 'Find Maxima' is called. Larger values will supress noise but may prevent small cells from being detected.
Sharpening Factor: An Unsharp Mask may be applied to separate touching cells. This value is the 'weight' of the mask. Recommended values are between 0-0.7
Smooth before growth: If selected the seeded growth is performed on the gaussian-smoothed image, otherwise the growth is performed on the original image.
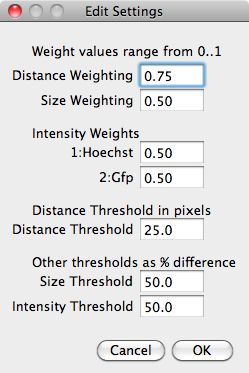
The 'Edit Settings' button opens a dialog box to edit experiment-wide settings:
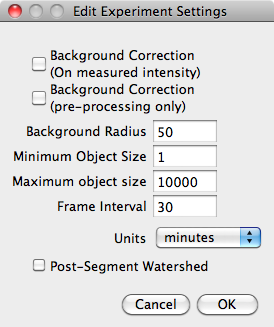 The Background Correction tick boxes select whether correction is performed on the images before measuring pixel intensities and whether it is performed on images before before segmentation. The ImageJ 'Background Subtractor' is used.
The Minimum and Maximum object sizes are used to filter out any objects which are too large or too small.
The frame interval and units will be set from the image metadata, if available, or changed here. These values may be used by future plugins.
If the 'Post-Segment Watershed' box is ticked, the ImageJ 'Watershed' command is called on the binary segmented images to separate clumped objects.
The 'Edit Channels' button opens the dialog box described in the 'Creating an new experiment' section above. Any image stacks which are added will be copied into the experiment directory.
The 'Preview' button displays a preview of the chosen segmentation. The 'Preview Settings' button allows the frame range and preview speed to be selected.
 If the 'Run Tracking' tick box is selected then tracking will be performed when the 'Run Segmentation' button is pressed. The 'Edit Tracking' button will allow the tracking method to be chosen and the tracking parameters to be edited.
The final 3 buttons perform the segmentation and tracking, launch the viewer application and quit the segmentation application respectively.
Experiment Viewer
The tracking viewer is launched by selecting the 'Experiment Viewer' from the ImageJ plugins menu. Two windows will open, shown below:
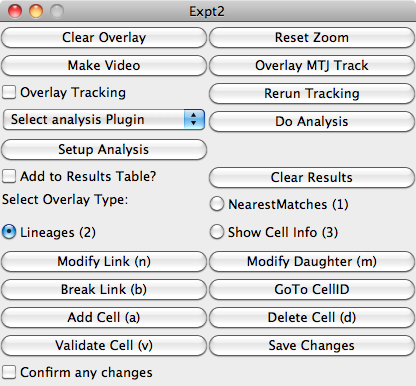
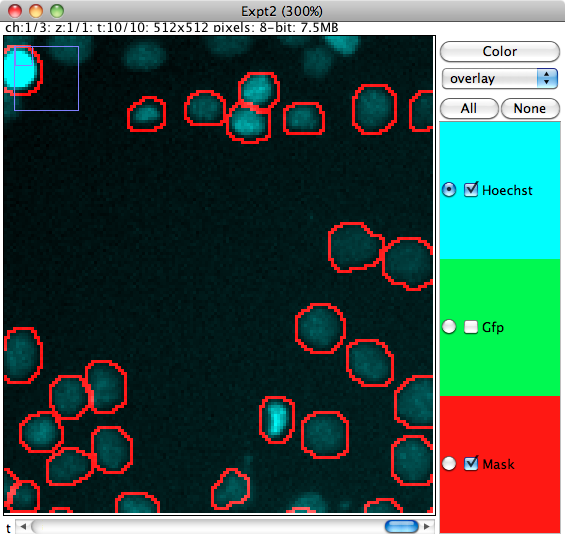
The viewer window is based on the Image5D plugin and displays the image channels and segmentation mask. Clicking in the window will select the cell nearest to the mouse pointer.
Description of Buttons
| Clear Overlay | Remove any overlaid highlighting from the window. |
| Reset Zoom | Reset to 100% magnification. |
| Make Video | Create a time-series image with the overlaid highlighting. |
| Load MTJ Track | Load and overlay an MTrackJ trajectory. |
| Overlay Tracking | When a tracked cell is selected, draw the full trajectory from current timepoint onwards. |
| Rerun Tracking | Allows tracking to be run with a different method or parameters. |
| Select Analysis Plugin | If any additional analysis plugins have been installed, they can be selected from here. When a cell is clicked in the viewer window, the plugin will be called for that cell. |
| Do Analysis | Call the selected analysis plugin for all cells in the experiment. |
| Setup Analysis | Edit any settings (if any) for the analysis plugin. Also used to display a brief description of the plugin. |
| Add to Results Table | When a cell is selected, add fluorescence intensity data to an ImageJ Results Table |
| Clear Results | Clear any currently open Results Tables. |
| Overlay Types: the next 3 buttons control the information displayed when a cell is highlighted in the window. | |
| 1) Nearest Matches | Overlay the Movement Scores for trajectories leaving the highlighted cell. |
| 2) Lineages | Display tracking, including daughter cells. |
| 3) Cell Info | Display fluorescence information for current timepoint. |
| The next three buttons modify tracking based on the previous two highlighted cells. To alter the link between two cells (in adjacent frames), click on one cell then move to the next frame and click on the second cell. Finally select one of the following buttons. | |
| Modify Link | Add the two selected cells as a trajectory |
| Modify Daughter | Add a trajectory, marking it as a cell division. If the parent cell already has a tracked ‘next cell’, that is marked as the other daughter cell. |
| Break Link | Remove the tracking between the two selected cells. |
| Go To CellID | Select a cell based on its ID number |
| Save Changes | Save any segmentation or tracking changes. |
| Add Cell | Expects a ‘closed’ ROI (such as oval or polygon). Calculates the cell features and adds a new cell. |
| Delete Cell | Deletes the currently selected cell. |
| Validate Cell | Marks the currently selected trajectory as ‘validated’. The validated cells are drawn with filled-in masks for easy identification. |
| Confirm Changes | Prompts the user before any actions which change the cell data. |
Adding and Editing Cells
To add a cell to the experiment, use the oval, polygon or freehand ROI tools to draw around the cell. Selecting 'Add Cell' will add the manually segmented cell to the experiment. To delete an existing segmented cell, select it in the window then click on 'Delete Cell'.
Adding and Editing Tracking
To remove tracking information from an individual cell, select the cell then click on 'Break Link'.
Each cell can hold up to two links to the next frame and one link to the previous frame. To add tracked link between two cells, click on both cells in turn then select 'Modify Link'. To indicate a cell division and add a daughter cell relationship, select the two cell as above then select 'Modify Daughter'.
Using Analysis Plugins
Any installed analysis plugins will be available from the 'Select Analysis Plugin' option. When a plugin has been selected, clicking on a cell will run the analysis on the selected cell or frame. To run the analysis on all frames, click on 'Do Analysis'. Clicking on 'Setup Analysis' will open the configuration settings for the plugin and optionally display brief usage instructions.