
WBS UK Probability Forecasts, Aug 2015
The figure below presents WBS’s latest (as of 28th August 2015) probabilistic forecasts for real GDP growth and inflation – for 2015 and 2016 – as histograms.
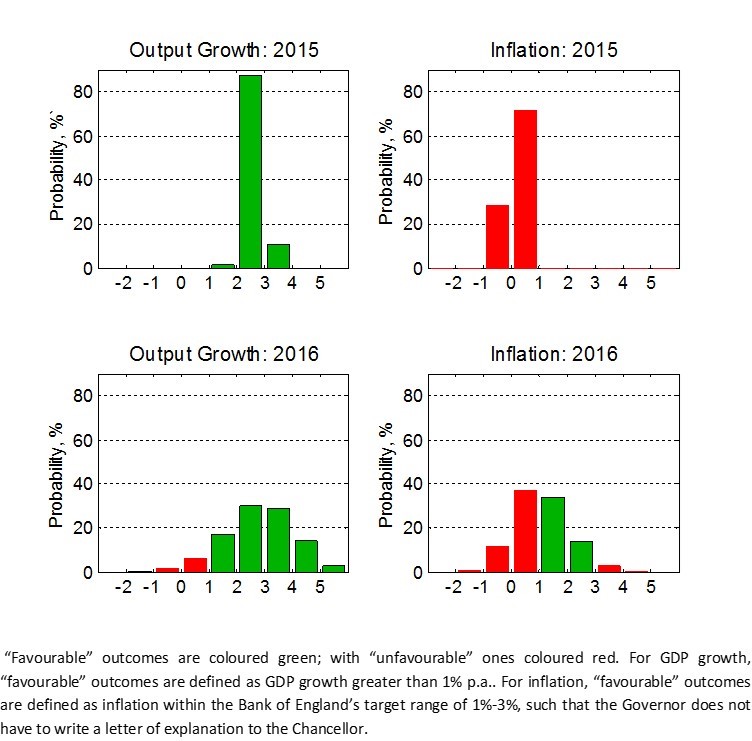
Inspection of the figure reveals that economic growth in the UK is expected to continue through 2015 and 2016. But prospects for 2016 are far less certain than for 2015 as the wider spread of the 2016 histogram indicates. The probability forecast of “favourable” outcomes of GDP growth greater than 1% in 2016 is 92%, with an 8% probability of an “unfavourable” outcome, as indicated by the red columns. These downside risks to GDP growth in 2016 have weakened slightly relative to a quarter ago and there is a 45% probability of growth exceeding 3%.
The most likely forecasted outturns for inflation in both 2015 and 2016 will involve a letter of explanation from the Bank of England Governor, as inflation falls below its target range. This follows UK inflation recently hitting lows due to weaker oil prices.
There is close to a 30% chance of deflation for 2015 as a whole.
But the WBS forecasting system has revised upwards, relative to a quarter ago, the probability that inflation returns to around its 2% target level in 2016 (see Table 1 below). It finds that there is now a one-in-two chance of inflation less than 1% in 2016, down from a four-in-five chance a quarter ago. And there is now only a one-in-ten chance of deflation in 2016 rather than a one-in-two chance as forecast a quarter ago. Our forecasts, therefore, point to a reduced risk that deflation and low inflation persist.
Event Forecasts
From the WBS forecast histograms we extract the following forecasts.
Table 1: Probability Event Forecasts for Annualised % Real GDP Growth and CPI Inflation
|
Year |
Real GDP Growth (%, p.a.) |
CPI Inflation (%, p.a.) |
||||
|
|
Prob(growth<0%) |
Prob(growth<1%) |
Prob(growth<2%) |
Prob(letter) |
Prob(CPI<1%) |
Prob(CPI>3%) |
|
2015 |
<1% |
<1% |
1% |
>99% |
>99% |
<1% |
|
2016 |
1% |
8% |
24% |
53% |
50% |
3% |
Table 1 shows that “robust” GDP growth, of around the pre-crisis trend growth rate, is expected in both 2015 and 2016. However, there remains about a one-in-four chance that GDP growth will be less than 2% in 2016.
The probability of deflation throughout 2015 has decreased from 84% a quarter ago to the current expectation of nearly 30%. But, the probability that inflation continues to fall outside its target range – specifically that it falls below 1% - remains greater than 99%. However the probability of a breach of the inflation target in 2016 has reduced by nearly 30 percentage points to 53%.
But these changes to our assessed risks of low inflation and deflation have not been associated with a material change to our GDP growth forecasts relative to those made by the WBS forecasting system a quarter or indeed two quarters ago.
Comparison with other forecasters
The main objective of the WBS forecasting system is to provide benchmark and judgement-free probability forecasts; and to assess the risks associated with other forecasts when these do not involve a direct communication of forecast uncertainty.
Accordingly, we take the most recent forecasts from the CBI, the Bank of England and HMT’s Panel of Independent Forecasters. While the Bank of England does provide an explicit assessment of forecast uncertainties for the UK, via “fan charts”, the CBI and the HMT Panel provide point forecasts only.
We use the WBS forecasting system histograms to compute the probability that GDP growth or inflation is greater than the other forecaster’s “point” forecast. If the point forecast from the other forecaster falls in the centre of the WBS forecast distribution we would expect this probability to be 50%. On the other hand, if the forecaster is more optimistic (pessimistic) than we suggest they should be the probability will be less (greater) than 50%.
Table 2: Forecast Comparison for 2015
|
|
Real GDP Growth (%, p.a.) |
CPI Inflation (%, p.a.) |
||
|
|
Point Forecast |
Prob. of a higher outturn |
Point Forecast |
Prob. of a higher outturn |
|
CBI |
2.6 |
56% |
0.2 |
30% |
|
Bank of England[1] |
2.7 |
40% |
0.1 |
50% |
|
HMT Panel1 |
2.6 |
56% |
0.2 |
30% |
Table 3: Forecast Comparison for 2016
|
|
Real GDP Growth (%, p.a.) |
CPI Inflation (%, p.a.) |
||
|
|
Point Forecast |
Prob. of a higher outturn |
Point Forecast |
Prob. of a higher outturn |
|
CBI |
2.8 |
52% |
1.5 |
29% |
|
Bank of England1 |
2.6 |
59% |
1.1 |
45% |
|
HMT Panel1 |
2.4 |
64% |
1.5 |
29% |
The CBI, Bank of England and HMT Panel point forecasts for GDP growth in 2015 fall within 0.1 of a percentage point of each other. However small differences matter, as the WBS system suggests a much lower probability of GDP growth exceeding the Bank or England’s GDP forecast than the CBI and the HMT panel forecasts. This is explained by greater certainty in the WBS system’s forecasts for 2015 than a quarter ago when the forecast histogram was wider as only one rather than two quarters of GDP data for 2015 were available.
The WBS forecasting system attaches a higher risk than the other forecasters to the possibility that the current low inflation rates in the UK persist into 2016. This is evidenced by the fact that the inflation point forecasts for 2016 from the other three forecasters, in particular the CBI and HMT, fall in the right-hand-side of the WBS forecasting system histogram. The system accordingly suggests that there is close to a two-in-three chance that inflation falls below their central expectations for 2016.
Note on the Warwick Business School Forecasting System
The Warwick Business School Forecasting System communicates forecast uncertainties for UK GDP growth and inflation in an open and transparent way – free from judgement. The system involves consideration of a range of cutting-edge econometric forecasting models, as opposed to relying on a single model which is likely misspecified.
Focus is on the production and publication of accurate probabilistic forecasts, using statistical methods, rather than constructing a narrative or story around one particular, but likely far from certain, possible set of outturns.
The WBS forecasts thus emphasise forecast uncertainties; and provide a benchmark against which one can assess the plausibility of other forecasts.
[1] The Bank of England (mean) forecasts for calendar year inflation are derived from their published forecasts for the four-quarter inflation rate and are, therefore, to be treated as approximate. The HMT Panel (mean) forecasts for inflation are four-quarter growth rates.