
WBS UK Probabilistic Forecasts, Oct 2019
The figure below presents WBSFS’s latest (as of 11th October 2019) probabilistic forecasts for real GDP growth and inflation – defined as year-on-year growth rates for 2019Q4 and 2020Q4 – as histograms. The information set used to produce these forecasts includes information on GDP growth up to 2019Q2 and data on CPI inflation up to August 2019.
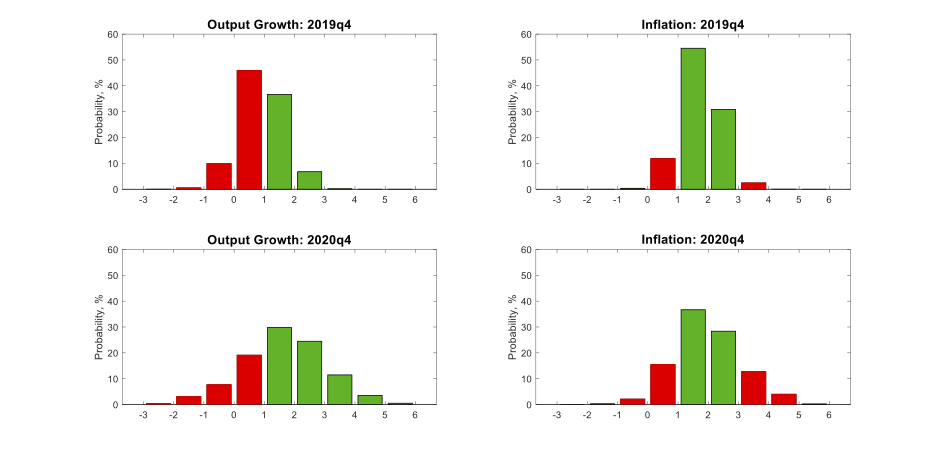
To aid visualisation, output growth forecast outcomes greater than 1% are coloured green, red otherwise. For inflation, green outcomes are defined as inflation within the Bank of England’s target range of 1%-3%, such that the Governor does not have to write a letter of explanation to the Chancellor; forecast outcomes outside the target range are coloured red.
Table 1 extracts from these histogram forecasts the probabilities of specific output growth and inflation events. The events considered are the probability of output growth being less than 0%, 1% and 2%, and of inflation lying outside the 1-3% target range (i.e., the probability of the Bank of England’s Governor having to write a letter explaining how and why inflation has breached its target range). Also reported are the individual probabilities of inflation being less than 1% and greater than 3%, to indicate which side of the target range is most likely to be breached.
Table 1: Probability Event Forecasts for 2019Q4 and 2020Q4 year-on-year Real GDP Growth and CPI Inflation
Year |
Real GDP Growth (%, p.a.) |
CPI Inflation (%, p.a.) |
||||
|
|
P(growth<0%) |
P(growth<1%) |
P(growth<2%) |
P(letter) |
P(inf<1%) |
P(inf>3%) |
Updated Forecasts (October 2019) |
||||||
2019Q4 |
10% |
56% |
93% |
15% |
12% |
3% |
2020Q4 |
11% |
30% |
60% |
35% |
18% |
17% |
Previous Forecasts (July 2019) |
||||||
2019Q4 |
4% |
20% |
60% |
32% |
28% |
4% |
2020Q4 |
8% |
24% |
53% |
41% |
26% |
15% |
An examination of the output growth forecasts for 2019Q4, reported in Table 1, suggests they were strongly affected by the 2019Q2 quarterly growth rate estimate of -0.2%. Compared with our forecasts made one quarter ago, the risk of “low” growth (growth less than 1%) in 2019Q4 is considerably higher than last quarter: the predictive probability of this event has increased from 20% to 56%. The most likely range for output growth in 2019Q4 is [0% to 1%], with a 1 in 2 probability, a shift down from the [1% to 2%] range predicted last quarter. Accordingly, the probability that growth in 2019Q4 exceeds 2% declined from 40% one quarter ago to just 7% in the current quarter.
The change in the predicted probabilities is less pronounced when looking further ahead to 2020q4. Whilst we forecast a lower chance, of 40%, that growth exceeds 2%, this represents a modest change compared to the probability forecast of 47% made last quarter. The most likely output growth range remains in the [1% to 2%] range, with a probability of 30%.
We also observe sizeable changes in the inflation outlook when updating the information set from July to October. The probability of inflation falling outside the [1% to 3%] range in 2019Q4 has decreased from 32% in July to 15% in October, although this partly reflects a reduction in uncertainty as the forecast horizon shortens. The probability of inflation being less than 1% in 2019Q4 has decreased from 28% last quarter to the current 12%; whilst the probability of inflation exceeding 3% is approximately the same as last quarter (3% compared to 4%). Looking further ahead to 2020q4, the forecast uncertainties remain, with the probability of writing a letter at 35%, reduced from 41% forecast a quarter ago. This largely arises due to a lower probability of inflation being less than 1%, 26% in July compared to 18% in October.