
Warwich Business School UK Forecasts, Feb 2015
WBS Forecasts for 2015 and 2016
The figure below presents WBS’s latest (as of 26th February 2015) probabilistic forecasts for real GDP growth and inflation – for 2015 and 2016 – as histograms.
“Favourable” outcomes are coloured green; with “unfavourable” ones coloured red. For GDP growth, “favourable” outcomes are defined as GDP growth greater than 1% p.a.. For inflation, “favourable” outcomes are defined as inflation within the Bank of England’s target range of 1%-3%, such that the Governor does not have to write a letter of explanation to the Chancellor.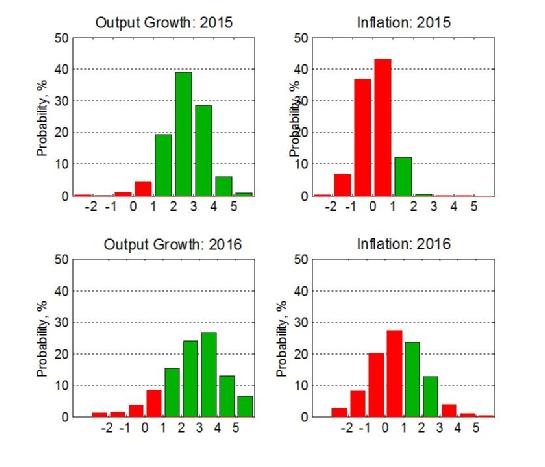
Inspection of the figure reveals that the balance of probabilities is such that the economic recovery in the UK is set to continue through 2015 and 2016. But, as the red columns indicate, the WBS forecasting system suggests that there remain clear downside risks to GDP growth. The 2016 histogram has a long left tail suggesting that, despite expected GDP growth of just under 3%, there is a 15% probability of “weak” growth of less than 1% (see Table 1 below).
The most likely forecasted outturns for inflation in both 2015 and 2016 will involve a letter of explanation from the Bank of England Governor, as inflation breaches its target range. The risks to inflation are clearly on the downside. This follows UK inflation recently falling to lows due to weaker oil prices. Business and policymakers should be increasingly alert to these downside risks.
Specifically, the WBS forecasting system forecasts an 87% chance that inflation is less than 1% in 2015 (see Table 1 below). And there is a 44% chance of deflation in 2015.
Importantly, and contrasting the assessment of the Bank of England that inflation will begin to return to the 2% target in 2016 (see Tables 2 and 3 below), the WBS forecasting system suggests there remains a 59% probability of inflation less than 1% in 2016; and a 31% chance of deflation in 2016. Our forecasts therefore point to a sizeable risk that the low inflation currently in the UK will persist. But this appears to be “good” inflation, given that GDP growth is not expected to fall back.
Event Forecasts
From the WBS forecast histograms we extract the following forecasts.
Table 1: Probability Event Forecasts for Annualised % Real GDP Growth and CPI Inflation
|
Year |
Real GDP Growth (%, p.a.) |
CPI Inflation (%, p.a.) |
||||
|
|
Prob(growth<0%) |
Prob(growth<1%) |
Prob(growth<2%) |
Prob(letter) |
Prob(CPI<1%) |
Prob(CPI>3%) |
|
2015 |
2% |
6% |
25% |
87% |
87% |
<1% |
|
2016 |
6% |
15% |
30% |
64% |
59% |
5% |
Table 1 shows that despite the fact that “robust” GDP growth, around pre-crisis trend growth rates, is expected in both 2015 and 2016, there remain clear downside risks particularly as the economy moves into 2016. There remains about a one-in-three chance that GDP growth will be less than 2% in 2016. This implies that one cannot presume that annualised growth will pick up to historically “normal” trend levels of between 2% and 3% p.a.
The probability of inflation falling below 1% in 2015 has more than doubled from 42% a quarter ago - to the current expectation of 87% - as oil prices, in particular, have continued to fall. Moreover, the WBS forecasting system emphasises that these risks of inflation falling beneath its target range remain high through 2016 – with close to a two-in-three chance that inflation is less than 1% in 2016. But these heightened risks of low inflation have not been associated with a material change to our GDP growth forecasts relative to those made by the WBS forecasting system a quarter ago.
Comparison with other forecasters
The main objective of the WBS forecasting system is to provide benchmark and judgement-free probability forecasts; and to assess the risks associated with other forecasts when these do not involve a direct communication of forecast uncertainty.
Accordingly, we take the most recent forecasts, all published in February 2015, from Oxford Economics (as issued in the IFS Green Budget 2015), the Bank of England and HMT’s Panel of Independent Forecasters. While the Bank of England does provide an explicit assessment of forecast uncertainties for the UK, via “fan charts”, Oxford Economics and the HMT Panel provide point forecasts only.
We use the WBS forecasting system histograms to compute the probability that GDP growth or inflation is greater than the other forecaster’s “point” forecast. If the point forecast from the other forecaster falls in the centre of the WBS forecast distribution we would expect this probability to be 50%. On the other hand, if the forecaster is more optimistic (pessimistic) than we suggest they should be the probability will be less (greater) than 50%.
Table 2: Comparison with other forecasters for 2015
|
|
Real GDP Growth (%, p.a.) |
CPI Inflation (%, p.a.) |
||
|
|
Point Forecast |
Prob. of a higher outturn |
Point Forecast |
Prob. of a higher outturn |
|
Oxford Economics: IFS Green Budget |
3.0 |
37% |
0.0 |
55% |
|
Bank of England[1] |
2.9 |
42% |
0.2 |
49% |
|
HMT Panel1 [1] |
2.6 |
55% |
0.9 |
15% |
Table 3: Comparison with other forecasters for 2016
|
|
Real GDP Growth (%, p.a.) |
CPI Inflation (%, p.a.) |
||
|
|
Point Forecast |
Prob. of a higher outturn |
Point Forecast |
Prob. of a higher outturn |
|
Oxford Economics: IFS Green Budget |
2.8 |
52% |
1.8 |
21% |
|
Bank of England [1] |
2.9 |
49% |
1.5 |
29% |
|
HMT Panel1 [1] |
2.3 |
64% |
1.8 |
21% |
While the Oxford Economics, Bank of England and HMT Panel point forecasts for GDP growth in 2015 fall quite close to the centre of the WBS forecasting system distribution, the HMT Panel expects lower growth outcomes than the WBS system in 2016. GDP growth is therefore likely to fall above their expectations.
The WBS forecasting system is more confident than these other forecasters that the currently low inflation rates in the UK will persist into 2016. This is evidenced by the fact that the inflation point forecasts for 2016 from the other three forecasters clearly fall in the right-hand-side of the WBS forecasting system histogram. The system accordingly suggests that there is at least a two-in-three chance that inflation falls below their central expectations for 2016.
[1] The Bank of England (mean) forecasts for calendar year inflation are derived from their published forecasts for the four-quarter inflation rate and are, therefore, to be treated as approximate. The HMT Panel (mean) forecasts for inflation are four-quarter growth rates.