
WBS UK Probability Forecasts, Nov 2015
The figure below presents WBS’s latest (as of 27th November 2015) probabilistic forecasts for real GDP growth and inflation – for 2015 and 2016 – as histograms.
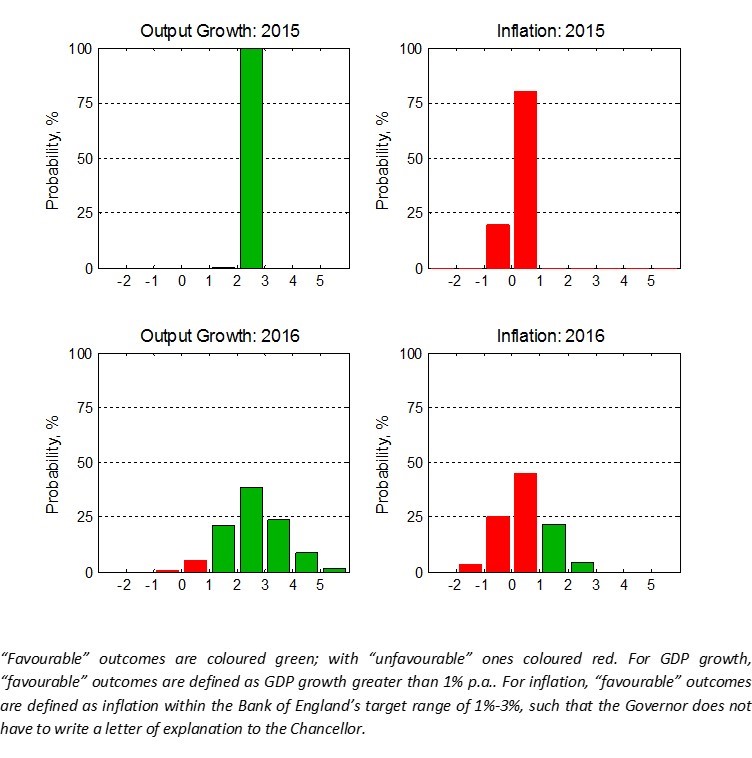
Inspection of the figure reveals that economic growth in the UK is expected to continue through 2016, with the most likely outcome being growth of between 2% and 3%. There is a one-in-three chance that growth exceeds 3%. As the red columns indicate, the WBS forecasting system suggests only moderate downside risks to GDP growth in 2016, with a 6% chance of growth less than 1% (see Table 1 below).
The most likely forecasted outturns for inflation in 2016 will, as in 2015, involve letters of explanation from the Bank of England Governor, as inflation is expected to fall beneath its 1% targeted lower bound with a 74% probability in 2016. This follows UK inflation recently hovering around zero due to weaker oil prices.
The WBS forecasting system has revised upwards, relative to a quarter ago, these probability forecasts of low inflation and indeed of deflation. It estimates a three-in-four chance of inflation less than 1% in 2016 relative to a one-in-two chance a quarter ago; and nearly a one-in-three chance of deflation in 2016. Our forecasts, therefore, point to a sizeable risk that low inflation persists. But this appears to be “good” low inflation, given that GDP growth is expected to continue.
Event Forecasts
From the WBS forecast histograms we extract the following forecasts.
Table 1: Probability Event Forecasts for Annualised % Real GDP Growth and CPI Inflation
|
Year |
Real GDP Growth (%, p.a.) |
CPI Inflation (%, p.a.) |
||||
|
|
Prob(growth<0%) |
Prob(growth<1%) |
Prob(growth<2%) |
Prob(letter) |
Prob(CPI<1%) |
Prob(CPI>3%) |
|
2015 |
<1% |
<1% |
<1% |
>99% |
>99% |
<1% |
|
2016 |
<1% |
6% |
28% |
74% |
74% |
<1% |
Table 1 shows that “robust” GDP growth, around pre-crisis trend growth rates, is expected in 2016 with only a 6% chance of growth less than 1% and a 28% chance of growth less than 2%. This builds on the solid growth experienced in 2015.
The risks to inflation in 2016 continue to be on the downside with close to a three-in-four chance that inflation is less than 1% in 2016. The probability of inflation greater than 3% is forecast to be negligible, in contrast to the Bank of England’s latest assessment in its November Inflation Report that there is an 8% chance in 2016q4. The WBS forecasting system therefore continues to place a higher probability on the currently low inflation in the UK persisting, consistent with the downward revision in inflation forecasts for 2016 by the Bank of England and other forecasters in recent months. But these low inflation risks have not been associated with a material change to our GDP growth forecasts relative to those made by the WBS forecasting system a quarter or indeed two quarters ago.
Comparison with other forecasters
The main objective of the WBS forecasting system is to provide benchmark and judgement-free probability forecasts; and to assess the risks associated with other forecasts when these do not involve a direct communication of forecast uncertainty.
Accordingly, we take the most recent forecasts from the OBR, the Bank of England and HMT’s Panel of Independent Forecasters. While the OBR and Bank of England provide an explicit assessment of forecast uncertainties for the UK, via “fan charts”, the HMT Panel provides point forecasts only.
We use the WBS forecasting system histograms to compute the probability that GDP growth or inflation is greater than the other forecaster’s “point” forecast. If the point forecast from the other forecaster falls in the centre of the WBS forecast distribution we would expect this probability to be 50%. On the other hand, if the forecaster is more optimistic (pessimistic) than we suggest they should be the probability will be less (greater) than 50%.
Table 2: Forecast Comparison for 2015
|
|
Real GDP Growth (%, p.a.) |
CPI Inflation (%, p.a.) |
||
|
|
Point Forecast |
Prob. of a higher outturn |
Point Forecast |
Prob. of a higher outturn |
|
OBR |
2.4 |
44% |
0.10 |
37% |
|
Bank of England[1] |
2.5 |
25% |
0.05 |
68% |
|
HMT Panel |
2.6 |
18% |
0.10 |
37% |
Table 3: Forecast Comparison for 2016
|
|
Real GDP Growth (%, p.a.) |
CPI Inflation (%, p.a.) |
||
|
|
Point Forecast |
Prob. of a higher outturn |
Point Forecast |
Prob. of a higher outturn |
|
OBR |
2.4 |
57% |
1.0 |
26% |
|
Bank of England[1] |
2.5 |
55% |
0.8 |
32% |
|
HMT Panel |
2.4 |
57% |
1.5 |
17% |
There is little between the 2015 point forecasts from the WBS forecasting system and the three forecasters considered in Table 2. But as the year nears its end and the forecast uncertainties for 2015 have reduced, one can discriminate between the 2015 forecasts in probabilistic terms. The HMT Panel, in particular, is seen from Table 2 to have more optimistic GDP growth forecasts - the WBS forecasting system suggests only an 18% chance of growth higher than the Panel expect. In contrast, OBR predictions are near the WBS forecasting system’s central values, since the probability of a higher outturn is not far from 50%. For inflation in 2015, there are only minor differences between the point forecasts seen in Table 2, although we find that Bank of England forecasts are lower than the WBS forecasting system’s central forecast, while the OBR forecasts are higher.
Looking ahead to 2016, Table 3 indicates that general agreement on the output growth forecast, but some disagreement on the inflation outlook. For GDP growth, the three forecasters’ central estimates fall closer to the centre of the WBS forecast distribution, even though all three forecasters are slightly less optimistic about growth than the WBS forecasting system.
In contrast there is less agreement for inflation. The WBS forecasting system is more confident than these other forecasters that the currently low inflation rates in the UK will persist into 2016. This is evidenced by the fact that the inflation point forecasts for 2016 from the other three forecasters clearly fall in the right-hand-side of the WBS forecasting system histogram. The system accordingly suggests that, depending on the forecaster examined in Table 3, there is between a four-in-five and two-in-three chance that inflation falls below their central expectations for 2016.
Note on the Warwick Business School Forecasting System
The Warwick Business School Forecasting System communicates forecast uncertainties for UK GDP growth and inflation in an open and transparent way – free from judgement. The system involves consideration of a range of cutting-edge econometric forecasting models, as opposed to relying on a single model which is likely misspecified.
Focus is on the production and publication of accurate probabilistic forecasts, using statistical methods, rather than constructing a narrative or story around one particular, but likely far from certain, possible set of outturns.
The WBS forecasts thus emphasise forecast uncertainties; and provide a benchmark against which one can assess the plausibility of other forecasts.
[1] The Bank of England (mean) forecasts for calendar year inflation are derived from their published forecasts for the four-quarter inflation rate and are, therefore, to be treated as approximate.