
WBS UK Probability Forecasts, May 2015
The figure below presents WBS’s latest (as of 28th May 2015) probabilistic forecasts for real GDP growth and inflation – for 2015 and 2016 – as histograms.
“Favourable” outcomes are coloured green; with “unfavourable” ones coloured red. For GDP growth, “favourable” outcomes are defined as GDP growth greater than 1% p.a.. For inflation, “favourable” outcomes are defined as inflation within the Bank of England’s target range of 1%-3%, such that the Governor does not have to write a letter of explanation to the Chancellor.
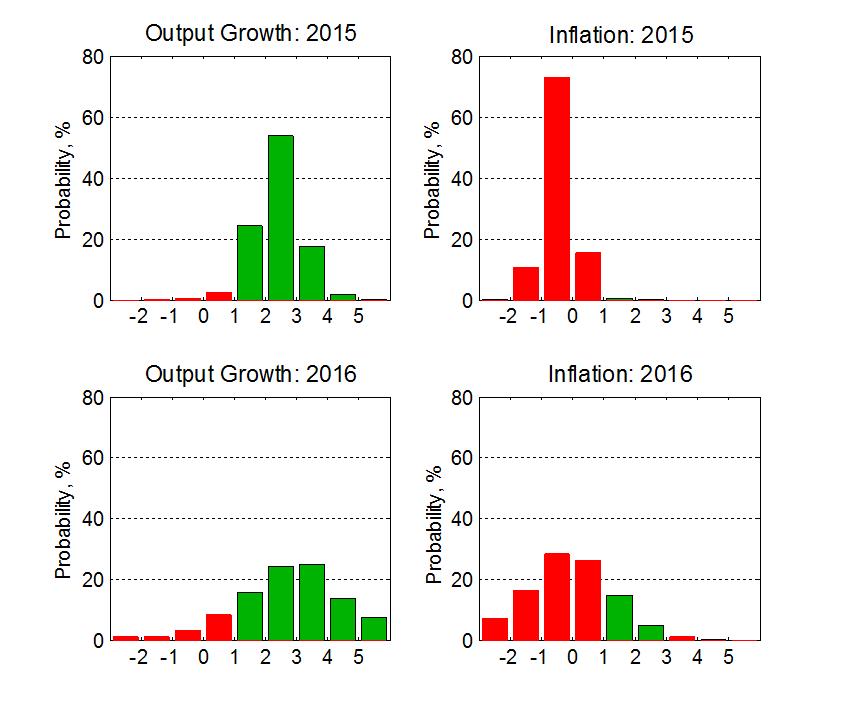
Inspection of the figure reveals that the economic recovery in the UK is likely to continue through 2015 and 2016, with the probability of growth exceeding 2% slightly higher than 70% in both years. But, as the red columns indicate, the WBS forecasting system suggests that there are downside risks to GDP growth looking ahead to 2016, although these risks have weakened slightly relative to a quarter ago. The 2016 histogram has a long left tail suggesting that, despite expected GDP growth of around 2.7%, there is more than a one-in-ten chance of “weak” growth of less than 1% (see Table 1 below).
The most likely forecasted outturns for inflation in both 2015 and 2016 will involve a letter of explanation from the Bank of England Governor, as inflation breaches its target range with near certainty in 2015 and with a 80% probability in 2016. This follows UK inflation recently dipping below zero due to weaker oil prices.
In contrast to the assessment of the Bank of England that inflation will be closer to the 2% target in 2016 (see Tables 2 and 3 below), the WBS forecasting system has revised upwards, relative to a quarter ago, its probability forecasts of low inflation and deflation. It estimates a four-in-five chance of inflation less than 1% in 2016; and a one-in-two chance of deflation in 2016. Our forecasts, therefore, point to a sizeable risk that deflation and low inflation persist. But this appears to be “good” inflation, given that GDP growth is not expected to fall back.
Event Forecasts
From the WBS forecast histograms we extract the following forecasts.
Table 1: Probability Event Forecasts for Annualised % Real GDP Growth and CPI Inflation
|
Year |
Real GDP Growth (%, p.a.) |
CPI Inflation (%, p.a.) |
||||
|
|
Prob(growth<0%) |
Prob(growth<1%) |
Prob(growth<2%) |
Prob(letter) |
Prob(CPI<1%) |
Prob(CPI>3%) |
|
2015 |
<1% |
3% |
27% |
>99% |
>99% |
<1% |
|
2016 |
5% |
13% |
28% |
80% |
79% |
1% |
Table 1 shows that despite the fact that “robust” GDP growth, around pre-crisis trend growth rates, is expected in both 2015 and 2016, there remain downside risks particularly as the economy moves into 2016. There remains about a one-in-three chance that GDP growth will be less than 2% in 2016. This implies that one cannot presume that annualised growth will pick up to historically “normal” trend levels of between 2% and 3% p.a.
The probability of deflation through 2015 has increased further relative to a quarter ago - to the current expectation of 84%. Accordingly, the probability that inflation continues to fall outside its target range – specifically that it falls below 1% - is greater than 99%. Moreover, the WBS forecasting system emphasises that these risks of inflation falling beneath its target range remain high through 2016 – with close to a four-in-five chance that inflation is less than 1% in 2016.
But these heightened risks of low inflation and deflation have not been associated with a material change to our GDP growth forecasts relative to those made by the WBS forecasting system a quarter or indeed two quarters ago.
Comparison with other forecasters
The main objective of the WBS forecasting system is to provide benchmark and judgement-free probability forecasts; and to assess the risks associated with other forecasts when these do not involve a direct communication of forecast uncertainty.
Accordingly, we take the most recent forecasts from the IMF, the Bank of England and HMT’s Panel of Independent Forecasters. While the Bank of England does provide an explicit assessment of forecast uncertainties for the UK, via “fan charts”, the IMF and the HMT Panel provide point forecasts only.
We use the WBS forecasting system histograms to compute the probability that GDP growth or inflation is greater than the other forecaster’s “point” forecast. If the point forecast from the other forecaster falls in the centre of the WBS forecast distribution we would expect this probability to be 50%. On the other hand, if the forecaster is more optimistic (pessimistic) than we suggest they should be the probability will be less (greater) than 50%.
Table 2: Forecast Comparison for 2015
|
|
Real GDP Growth (%, p.a.) |
CPI Inflation (%, p.a.) |
||
|
|
Point Forecast |
Prob. of a higher outturn |
Point Forecast |
Prob. of a higher outturn |
|
IMF |
2.7 |
34% |
0.1 |
12% |
|
Bank of England[1] |
2.5 |
49% |
0.3 |
7% |
|
HMT Panel |
2.5 |
46% |
0.3 |
5% |
Table 3: Forecast Comparison for 2016
|
|
Real GDP Growth (%, p.a.) |
CPI Inflation (%, p.a.) |
||
|
|
Point Forecast |
Prob. of a higher outturn |
Point Forecast |
Prob. of a higher outturn |
|
IMF |
2.3 |
64% |
1.7 |
10% |
|
Bank of England[1] |
2.6 |
58% |
1.4 |
13% |
|
HMT Panel |
2.3 |
64% |
1.6 |
11% |
While the Bank of England and HMT Panel point forecasts for GDP growth in 2015 fall quite close to the centre of the WBS forecasting system distribution, the IMF is more optimistic. In contrast, the IMF and HMT Panel, in particular, predict lower growth outcomes than the WBS system in 2016 – according to our forecast densities, GDP growth is therefore more likely than not to be higher than their forecasts.
The WBS forecasting system is more confident than these other forecasters that the currently low and negative inflation rates in the UK will persist into 2016. This is evidenced by the fact that the inflation point forecasts for 2016 from the other three forecasters clearly fall in the right-hand-side of the WBS forecasting system histogram. The system accordingly suggests that there is close to a nine-in-ten chance that inflation falls below their central expectations for 2016. We stress that our forecasts are judgement-free, and involve “automatic” model estimation and forecasting.
Note on the Warwick Business School Forecasting System
The Warwick Business School Forecasting System communicates forecast uncertainties for UK GDP growth and inflation in an open and transparent way – free from judgement. The system involves consideration of a range of cutting-edge econometric forecasting models, as opposed to relying on a single model which is likely misspecified.
Focus is on the production and publication of accurate probabilistic forecasts, using statistical methods, rather than constructing a narrative or story around one particular, but likely far from certain, possible set of outturns.
The WBS forecasts thus emphasise forecast uncertainties; and provide a benchmark against which one can assess the plausibility of other forecasts. A note summarising the System, and evaluating its historical performance, is available at this link.[1] The Bank of England (mean) forecasts for calendar year inflation are derived from their published forecasts for the four-quarter inflation rate and are, therefore, to be treated as approximate.