
WBS UK Probabilistic Forecasts, May 2019
WBS Forecasts for 2019 and 2020
The figure below presents WBS’s latest (as of 10thMay 2019) probabilistic forecasts for real GDP growth and inflation – for 2019 and 2020 – as histograms.
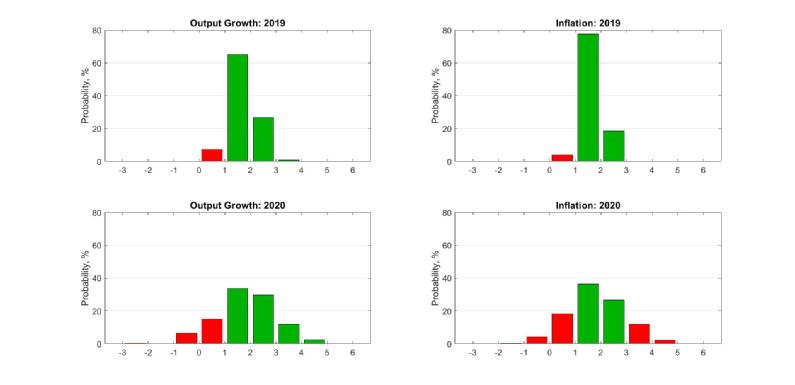
“Favourable” outcomes are coloured green; with “unfavourable” ones coloured red. For GDP growth, “favourable” outcomes are defined as GDP growth greater than 1% p.a.. For inflation, “favourable” outcomes are defined as inflation within the Bank of England’s target range of 1%-3%, such that the Governor does not have to write a letter of explanation to the Chancellor.
Conditioning on the latest GDP estimates from the ONS for 2019Q1, the WBS forecasting system has revised upwards by 13 percentage points, relative to one quarter ago, the probability that economic growth in 2019 will be between 1% and 2%. There is now a 65% chance that this event will occur (see Figure and Table 1), compared with 52% forecast one quarter ago. There is also now close to a 1-in-3 chance (28%) that growth exceeds 2% in 2019; and the chance of growth less than 1% in 2019 is just 7%, compared with 26% forecast one quarter ago.
But prospects for 2020 are more uncertain. While there is a 44% chance that GDP growth exceeds 2% there remains a 22% chance of growth less than 1%.
The chances that inflation in 2019 falls outside its ‘target range’ of between 1% and 3% have decreased from 15% one quarter ago to just 4%. But there is forecast to be a 37% chance that inflation falls outside its target range in 2020. This is explained primarily by downside risks – there is a 23% chance of inflation less than 1% in 2020 compared with a 14% chance of inflation exceeding 3%.
Table 1: Probability Event Forecasts for Annualised % Real GDP Growth and CPI Inflation
Year |
Real GDP Growth (%, p.a.) |
CPI Inflation (%, p.a.) |
||||
|
|
Prob(growth<0%) |
Prob(growth<1%) |
Prob(growth<2%) |
Prob(letter) |
Prob(CPI<1%) |
Prob(CPI>3%) |
|
2019 |
<0.1% |
7% |
72% |
4% |
4% |
<0.1% |
|
2020 |
7% |
22% |
56% |
37% |
23% |
14% |
Comparison with other forecasters
The main objective of the WBS forecasting systemis to provide benchmark and judgement-free probability forecasts; and to assess the risks associated with other forecasts.
Accordingly, we take the most recent point forecasts from the Bank of England, the IMF and the average of the HMT survey of professional forecasters. While the Bank of England provide an explicit assessment of forecast uncertainties for the UK, via “fan charts”, the IMF and HMT provide point forecasts only.
We use the WBS forecasting system probabilistic predictions to compute the probability that GDP growth or inflation is greater than the other forecaster’s “point” forecast. If the point forecast from the other forecaster falls in the centre of the WBS histograms we would expect this probability to be 50%. On the other hand, if the forecaster predicts a larger (lower) value than our central predictions they should have a probability less (greater) than 50%.
Tables 2 and 3 show that other forecasters are more pessimistic about GDP growth prospects than the WBS forecasting system, in particular for 2019 but to a lesser extent also for 2020. In 2019 the probability of a higher outturn is, with the exception of the Bank of England in 2020, always more than 66%.
There is also disagreement about what will happen to inflation. This is especially so in 2019, as all three forecasters predict higher inflation than the WBS forecasting system. But by 2020 the WBS forecasting system does forecast inflation closer to the other forecasters; although the WBS forecasting system’s forecasts remain lower.
Table 2: Forecast Comparison for 2019
|
|
Real GDP Growth (%, p.a.) |
CPI Inflation (%, p.a.) |
||
|
|
Point Forecast |
Prob. of a higher outturn |
Point Forecast |
Prob. of a higher outturn |
|
Bank of England[1] |
1.38 |
78% |
1.83 |
32% |
|
IMF |
1.20 |
86% |
1.80 |
32% |
|
HMT survey [2] |
1.30 |
82% |
1.90 |
25% |
Table 3: Forecast Comparison for 2020
|
|
Real GDP Growth (%, p.a.) |
CPI Inflation (%, p.a.) |
||
|
|
Point Forecast |
Prob. of a higher outturn |
Point Forecast |
Prob. of a higher outturn |
|
Bank of England1 |
1.76 |
53% |
1.87 |
45% |
|
IMF |
1.40 |
66% |
2.00 |
41% |
|
HMT survey[2] |
1.40 |
66% |
2.10 |
37% |
Note on the Warwick Business School Forecasting System
The Warwick Business School Forecasting Systemcommunicates forecast uncertainties for UK GDP growth and inflation in an open and transparent way – free from judgement. The system involves consideration of a range of cutting-edge econometric forecasting models, as opposed to relying on a single model which is likely misspecified.
Focus is on the production and publication of accurate probabilistic forecasts, using statistical methods, rather than constructing a narrative or story around one particular, but likely far from certain, possible set of outturns.
The WBS forecasts thus emphasise forecast uncertainties; and provide a benchmark against which one can assess the plausibility of other forecasts.
[1]The Bank of England (mean) forecasts for calendar year inflation are derived from their published forecasts for the four-quarter inflation rate and are, therefore, to be treated as approximate.
[2]Forecasts for Inflation are for Q4 values.