
WBS UK Probabilistic Forecasts, May 2018
WBS Forecasts for 2018 and 2019
The figure below presents WBS’s latest (as of 25th May 2018) probabilistic forecasts for real GDP growth and inflation – for 2018 and 2019 – as histograms.
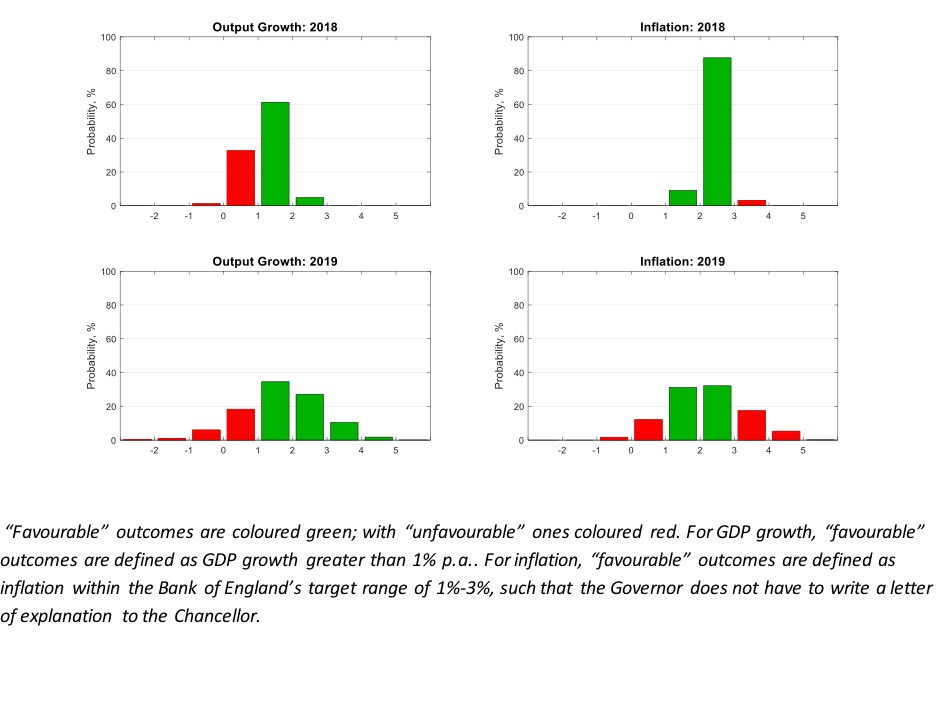
Conditioning on the latest GDP data from the ONS for 2018Q1, both the figure and Table 1 below reveal that the most likely outcome is for economic growth to be between 1% and 2% in both 2018 and 2019. There is, however, much more uncertainty about growth in 2019 than 2018, with a 40-in-100 chance of growth greater than 2% in 2019, versus just a 5-in-100 chance for 2018.
Relative to one quarter ago, the WBSFS has revised upwards its estimates of ‘slow’ growth of less than 1%, especially for 2018. Previously there was an 18% chance of growth less than 1% in 2018 and a 20% chance of growth less than 1% in 2019; these estimates, as seen in Table 1, are now 34% and 26% respectively.
Relative to our forecasts made one quarter ago, inflation risks have fallen considerably for 2018. There is now only a 3-in-100 chance that inflation exceeds 3% in 2018, relative to a 40-in-100 chance forecast one quarter ago. There is also a reduced prospect that inflation persists into 2019, with a 2-in-5 chance that inflation exceeds 3% in 2019 relative to the 1-in-3 chance forecast one quarter ago.
Table 1: Probability Event Forecasts for Annualised % Real GDP Growth and CPI Inflation
Year |
Real GDP Growth (%, p.a.) |
CPI Inflation (%, p.a.) |
||||
|
|
Prob(growth<0%) |
Prob(growth<1%) |
Prob(growth<2%) |
Prob(letter) |
Prob(CPI<1%) |
Prob(CPI>3%) |
2018 |
1% |
34% |
95% |
3% |
<1% |
3% |
2019 |
8% |
26% |
60% |
37% |
14% |
23% |
Comparison with other forecasters
The main objective of the WBS forecasting system is to provide benchmark and judgement-free probability forecasts; and to assess the risks associated with other forecasts.
Accordingly, we take the most recent point forecasts from the Bank of England, the NIESR and HMT’s Panel of Independent Forecasters. While the Bank of England and the NIESR provide an explicit assessment of forecast uncertainties for the UK, via “fan charts”, the HMT Panel provide point forecasts only.
We use the WBS forecasting system histograms to compute the probability that GDP growth or inflation is greater than the other forecaster’s “point” forecast. If the point forecast from the other forecaster falls in the centre of the WBS forecast distribution we would expect this probability to be 50%. On the other hand, if the forecaster is more optimistic (pessimistic) than we suggest they should have a probability less (greater) than 50%.
Table 2: Forecast Comparison for 2018
|
|
Real GDP Growth (%, p.a.) |
CPI Inflation (%, p.a.) |
||
|
|
Point Forecast |
Prob. of a higher outturn |
Point Forecast |
Prob. of a higher outturn |
Bank of England[1] |
1.56 |
39% |
2.34 |
55% |
NIESR |
1.40 |
34% |
2.40 |
47% |
HMT |
1.50 |
25% |
2.50 |
37% |
Table 3: Forecast Comparison for 2019
|
|
Real GDP Growth (%, p.a.) |
CPI Inflation (%, p.a.) |
||
|
|
Point Forecast |
Prob. of a higher outturn |
Point Forecast |
Prob. of a higher outturn |
Bank of England1 |
1.70 |
50% |
2.08 |
52% |
NIESR |
1.70 |
50% |
2.10 |
50% |
HMT |
1.60 |
54% |
2.00 |
55% |
Table 2 shows that the Bank of England, NIESR and HMT Panel are all more optimistic than the WBSFS about GDP growth in 2018. But looking further ahead to 2019 we see that all three forecasters come into line with the forecasts from the WBSFS, with their point forecasts falling in the centre of the WBS forecast distribution.
The WBSFS also suggests that the Bank of England, NIESR and HMT Panel all agree with the WBSFS that inflation will fall towards the centre of the WBS forecast distribution, seen in the Figure above, in 2019. There is also a reasonable consensus, across the three forecasters, that this will also happen in 2018, although there is HMT Panel’s forecast for inflation is seen as falling more to the right of the WBS forecast distribution indicating their belief of slightly elevated inflation risks.
Note on the Warwick Business School Forecasting System
The Warwick Business School Forecasting System communicates forecast uncertainties for UK GDP growth and inflation in an open and transparent way – free from judgement. The system involves consideration of a range of cutting-edge econometric forecasting models, as opposed to relying on a single model which is likely misspecified.
Focus is on the production and publication of accurate probabilistic forecasts, using statistical methods, rather than constructing a narrative or story around one particular, but likely far from certain, possible set of outturns.
The WBS forecasts thus emphasise forecast uncertainties; and provide a benchmark against which one can assess the plausibility of other forecasts.
[1] The Bank of England (mean) forecasts for calendar year inflation are derived from their published forecasts for the four-quarter inflation rate and are, therefore, to be treated as approximate.