
WBS UK Probabilistic Forecasts, Nov 2018
Note: Given changes to the ONS’s publication model for GDP in summer 2018, this and future releases of the Warwick Business School Forecasting System will now be timed so that they condition on the ONS’s “first quarterly estimate” of GDP.
WBS Forecasts for 2018 and 2019
The figure below presents WBS’s latest (as of 9th November 2018) probabilistic forecasts for real GDP growth and inflation – for 2018 and 2019 – as histograms.
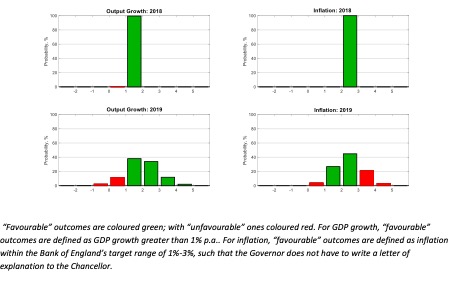
Conditioning on the latest GDP data from the ONS for 2018Q3, both the figure and Table 1 below reveal that it is now almost certain, as we approach the year end, that economic growth in 2018 is between 1% and 2%. There is, however, much more uncertainty about growth in 2019, with a greater than 1-in-10 chance of growth less than 1% in 2019, and nearly a 1-in-2 chance of growth greater than 2%.
Again, while it is almost certain that inflation falls between 2% and 3% in 2018, looking ahead to 2019 the WBS forecasting systempredicts close to a 1-in-3 chance that inflation falls outside the 1% to 3% band. The risks on the upside (inflation exceeding 3%) are greater, by around 20% points, than those on the downside (inflation falling below 1%).
Table 1: Probability Event Forecasts for Annualised % Real GDP Growth and CPI Inflation (extracted from the WBS forecast histograms)
Year |
Real GDP Growth (%, p.a.) |
CPI Inflation (%, p.a.) |
||||
|
|
Prob(growth<0%) |
Prob(growth<1%) |
Prob(growth<2%) |
Prob(letter) |
Prob(CPI<1%) |
Prob(CPI>3%) |
2018 |
<1% |
<1% |
>99% |
<1% |
<1% |
<1% |
2019 |
3% |
14% |
52% |
28% |
4% |
24% |
Comparison with other forecasters
The main objective of the WBS forecasting systemis to provide benchmark and judgement-free probability forecasts; and to assess the risks associated with other forecasts.
Accordingly, we take the most recent point forecasts from the Bank of England, the IMF and HMT’s Panel of Independent Forecasters. While the Bank of England provides an explicit assessment of forecast uncertainties for the UK, via “fan charts”, the IMF and the HMT Panel provide point forecasts only.
We use the WBS forecasting systemhistograms to compute the probability that GDP growth or inflation is greater than the other forecaster’s “point” forecast. If the point forecast from the other forecaster falls in the centre of the WBS forecast distribution we would expect this probability to be 50%. On the other hand, if the forecaster is more optimistic (pessimistic) than we suggest they should have a probability less (greater) than 50%.
Table 2: Forecast Comparison for 2018
|
|
Real GDP Growth (%, p.a.) |
CPI Inflation (%, p.a.) |
||
|
|
Point Forecast |
Prob. of a higher outturn |
Point Forecast |
Prob. of a higher outturn |
|
Bank of England[1] |
1.39 |
27% |
2.46 |
71% |
|
IMF |
1.40 |
27% |
2.50 |
41% |
|
HMT Panel |
1.30 |
58% |
2.40 |
82% |
Table 3: Forecast Comparison for 2019
|
|
Real GDP Growth (%, p.a.) |
CPI Inflation (%, p.a.) |
||
|
|
Point Forecast |
Prob. of a higher outturn |
Point Forecast |
Prob. of a higher outturn |
|
Bank of England1 |
1.73 |
58% |
2.24 |
57% |
|
IMF |
1.50 |
67% |
2.20 |
58% |
|
HMT Panel |
1.50 |
67% |
2.10 |
63% |
Table 2 shows that Bank of England and IMF (HMT Panel) are more optimistic (pessimistic) about GDP growth in 2018 than the WBSFS, as the probability of a higher outturn is less (more) than 50%. But, this disagreement is within the narrow 1%-2% range; reflecting the fact that we now have observed GDP data for three-quarters of 2018 resulting on a reduced forecasting uncertainty; so, in fact, the takeaway from Table 2 is that all three forecasters agree with the WBSFS that GDP growth in 2018 is almost certainly going to fall between 1% and 2%.
But looking at Table 3 there is more uncertainty about GDP growth prospects for 2019. According to the WBSFS, all three forecasters are too pessimistic, with the WBSFS suggesting a greater than 50% chance that growth exceeds their point forecasts.
Table 2 also shows that the Bank of England’s and HMT Panel’s forecasts for inflation in 2018 fall to the left of the WBSFS forecast distribution – indicating that the Bank of England and the HMT Panel anticipate lower inflation this year. But, as with GDP growth, reflecting the inflation data now available for 2018, there is in fact little disagreement between the forecasters about inflation prospects for this year; they agree that the most likely outcome is inflation of around 2.5%. Looking ahead to 2019, Table 3 shows that the Bank, HMT Panel and IMF all expect lower inflation, as the WBSFS forecasts a greater than 50% chance that inflation exceeds their point forecasts.
Note on the Warwick Business School Forecasting System
The Warwick Business School Forecasting Systemcommunicates forecast uncertainties for UK GDP growth and inflation in an open and transparent way – free from judgement. The system involves consideration of a range of cutting-edge econometric forecasting models, as opposed to relying on a single model which is likely misspecified.
Focus is on the production and publication of accurate probabilistic forecasts, using statistical methods, rather than constructing a narrative or story around one particular, but likely far from certain, possible set of outturns.
The WBS forecasts thus emphasise forecast uncertainties; and provide a benchmark against which one can assess the plausibility of other forecasts.
[1]The Bank of England (mean) forecasts for calendar year inflation are derived from their published forecasts for the four-quarter inflation rate and are, therefore, to be treated as approximate.