
WBS UK Probabilistic Forecasts, Feb 2019
WBS Forecasts for 2019 and 2020
The figure below presents WBS’s latest (as of 11th February 2019) probabilistic forecasts for real GDP growth and inflation – for 2019 and 2020 – as histograms.
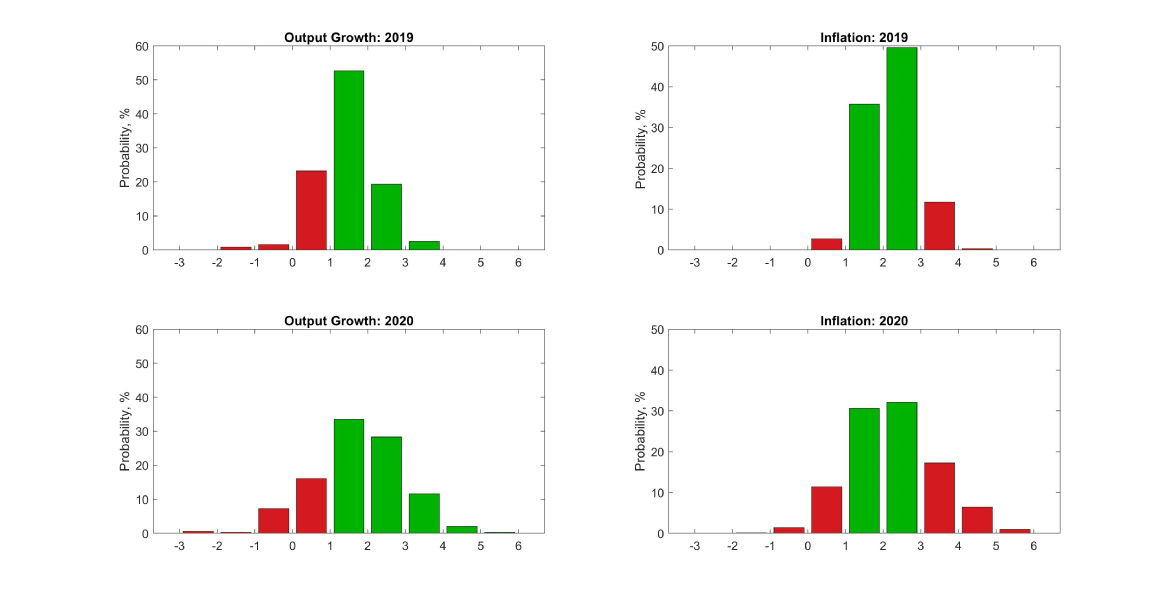
“Favourable” outcomes are coloured green; with “unfavourable” ones coloured red. For GDP growth, “favourable” outcomes are defined as GDP growth greater than 1% p.a.. For inflation, “favourable” outcomes are defined as inflation within the Bank of England’s target range of 1%-3%, such that the Governor does not have to write a letter of explanation to the Chancellor.
Conditioning on the latest GDP data from the ONS for 2018Q4, the figure and Table 1 below show the WBS forecasting system to predict that it is most likely (with 52% probability) that economic growth in 2019 is between 1% and 2%. There is, however, close to a 1-in-4 chance that growth is less than 1%; and a 80% chance than growth is less than 2% in 2019. One quarter ago, the WBS forecasting system predicted a 50% chance than growth would be less than 2%: so downside risks have increased. Looking out to 2020 uncertainty increases, with a higher chance, at 24%, of growth less than 1% and a 58% chance of growth less than 2%.
While the most likely forecast outcome is that inflation falls in its target range, between 1% and 3%, the WBS forecasting system predicts that the chances of inflation breaching this target increase from 15%, in 2019, to 38% in 2020. Inflation risks are on the upside: the WBS forecasting system forecasts a 25% chance that inflation exceeds 3% in 2020 relative to a smaller 13% chance that inflation falls below 1%.
Table 1: Probability Event Forecasts for Annualised % Real GDP Growth and CPI Inflation (extracted from the WBS forecast histograms)
|
Year |
Real GDP Growth (%, p.a.) |
CPI Inflation (%, p.a.) |
||||
|
|
Prob(growth<0%) |
Prob(growth<1%) |
Prob(growth<2%) |
Prob(letter) |
Prob(CPI<1%) |
Prob(CPI>3%) |
|
2019 |
2% |
26% |
78% |
15% |
3% |
12% |
|
2020 |
8% |
24% |
58% |
38% |
13% |
25% |
Comparison with other forecasters
The main objective of the WBS forecasting system is to provide benchmark and judgement-free probability forecasts; and to assess the risks associated with other forecasts.
Accordingly, we take the most recent point forecasts from the Bank of England, the IMF and the OECD. While the Bank of England provide an explicit assessment of forecast uncertainties for the UK, via “fan charts”, the IMF and the OECD provide point forecasts only.
We use the WBS forecasting system histograms to compute the probability that GDP growth or inflation is greater than the other forecaster’s “point” forecast. If the point forecast from the other forecaster falls in the centre of the WBS forecast distribution we would expect this probability to be 50%. On the other hand, if the forecaster is more optimistic (pessimistic) than we suggest they should have a probability less (greater) than 50%.
Table 2 shows that forecasters are more pessimistic about GDP growth in both 2019 and 2020 than the WBS forecasting system, as the probability of a higher outturn is in general more than 50%. The Bank of England, in particular, is more pessimistic about GDP growth prospects in 2019, We also observe a more pessimistic output growth forecast scenario from the OECD, especially for 2020.
There is less disagreement about inflation, especially in 2020. All three forecasters, like the WBS forecasting system, forecast that inflation is most likely to be around 2%. But the WBS forecasting system does forecast a little more inflation than the Bank of England in 2019, suggesting there is a 62% chance that inflation turns out higher than the Bank’s point estimate of 2%.
Table 2: Forecast Comparison for 2019
|
|
Real GDP Growth (%, p.a.) |
CPI Inflation (%, p.a.) |
||
|
|
Point Forecast |
Prob. of a higher outturn |
Point Forecast |
Prob. of a higher outturn |
|
Bank of England[1] |
1.17 |
66% |
2.01 |
62% |
|
IMF |
1.50 |
46% |
2.20 |
48% |
|
OECD |
1.40 |
58% |
2.30 |
43% |
[1] The Bank of England (mean) forecasts for calendar year inflation are derived from their published forecasts for the four-quarter inflation rate and are, therefore, to be treated as approximate.
Table 3: Forecast Comparison for 2020
|
|
Real GDP Growth (%, p.a.) |
CPI Inflation (%, p.a.) |
||
|
|
Point Forecast |
Prob. of a higher outturn |
Point Forecast |
Prob. of a higher outturn |
|
Bank of England[1] |
1.61 |
57% |
2.11 |
52% |
|
IMF |
1.60 |
57% |
2.00 |
56% |
|
OECD |
1.10 |
73% |
2.10 |
52% |
Note on the Warwick Business School Forecasting System
The Warwick Business School Forecasting System communicates forecast uncertainties for UK GDP growth and inflation in an open and transparent way – free from judgement. The system involves consideration of a range of cutting-edge econometric forecasting models, as opposed to relying on a single model which is likely misspecified.
Focus is on the production and publication of accurate probabilistic forecasts, using statistical methods, rather than constructing a narrative or story around one particular, but likely far from certain, possible set of outturns.
The WBS forecasts thus emphasise forecast uncertainties; and provide a benchmark against which one can assess the plausibility of other forecasts.