
WBS UK Probability Forecasts, Feb 2016
The figure below presents WBS’s latest (as of 25th February 2016) probabilistic forecasts for real GDP growth and inflation – for 2016 and 2017 – as histograms.
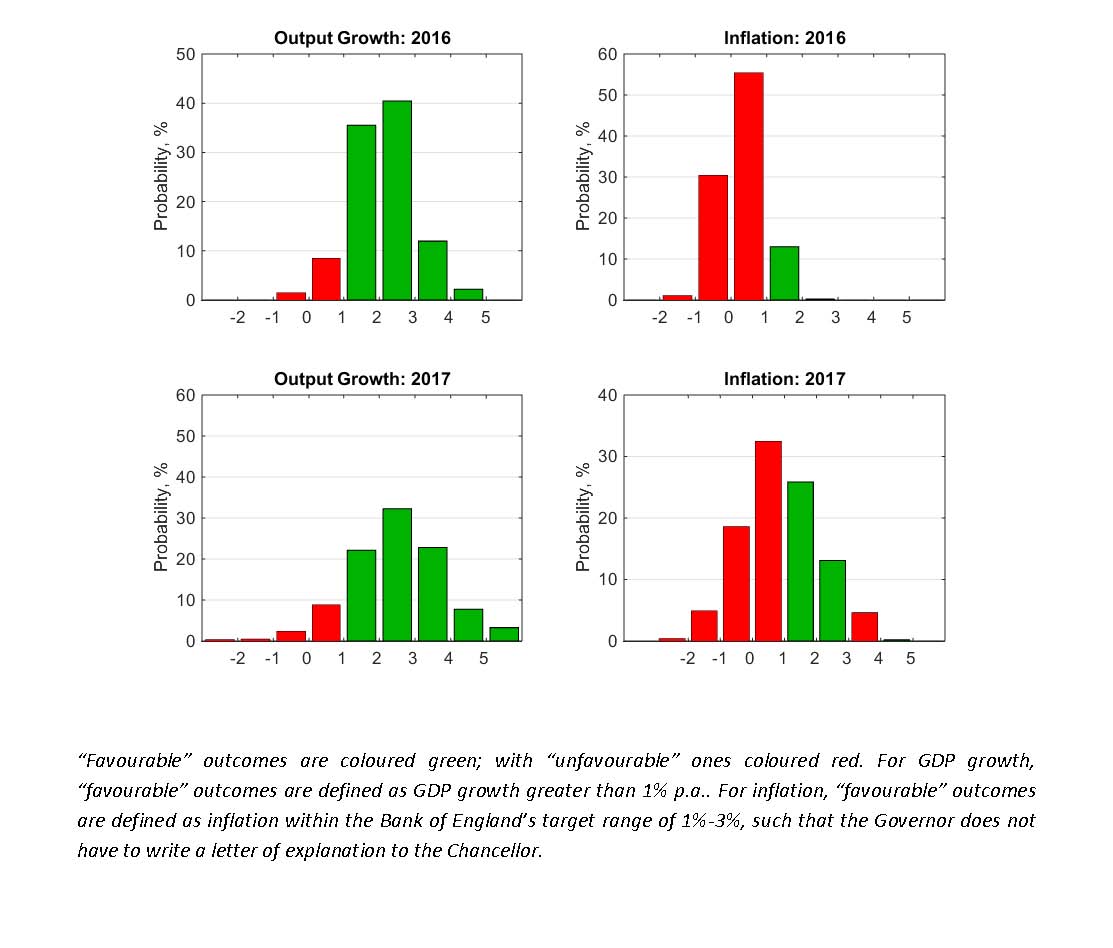
Inspection of the figure reveals that economic growth in the UK is expected to continue through 2016 and 2017, with the most likely outcomes being growth of between 2% and 3%. But the downside risks to growth, notably in 2016, have increased markedly relative to predictions a quarter ago. There is now believed to be a 10% chance of growth less than 1% in 2016; and a 45% chance of growth less than 2%. (For further details see Table 1 below). The upside and downside risks to growth are more evenly matched as we look ahead to 2017.
The most likely forecast outturns for inflation in 2016 and 2017 will, as in 2015, involve letters of explanation from the Bank of England Governor, as inflation is again strongly predicted to fall beneath its 1% targeted lower bound. This follows UK inflation recently hovering around zero due to weaker oil and food prices.
The WBS forecasting system has revised upwards these probability forecasts of low inflation and deflation. It estimates close to a nine-in-ten chance of inflation less than 1% in 2016 relative to a one-in-two chance half a year ago; and estimates nearly a one-in-three chance of deflation in 2016 relative to little more than a one-in-ten chance half a year ago. In 2017, there remains a three-in-five chance of inflation less than 1% and a one-in-four chance of deflation. Our forecasts, therefore, point to a sizeable risk that this low inflation persists over the next couple of years. But this appears to be “good” low inflation, given that GDP growth is expected to continue, albeit now with heightened downside risks.
Event Forecasts
From the WBS forecast histograms we extract the following forecasts.
Table 1: Probability Event Forecasts for Annualised % Real GDP Growth and CPI Inflation
|
Year |
Real GDP Growth (%, p.a.) |
CPI Inflation (%, p.a.) |
||||
|
|
Prob(growth<0%) |
Prob(growth<1%) |
Prob(growth<2%) |
Prob(letter) |
Prob(CPI<1%) |
Prob(CPI>3%) |
|
2016 |
1% |
10% |
45% |
87% |
87% |
<1% |
|
2017 |
3% |
12% |
33% |
61% |
56% |
5% |
Table 1 indicates that “robust” GDP growth, around pre-crisis trend growth rates, is expected in 2016. But the downside risks have increased relative to a quarter ago. There is now believed to be a 10% chance of growth less than 1%, compared to a 6% chance a quarter ago, and a 45% chance of growth less than 2%, relative to a 28% chance a quarter ago.
The risks to inflation in 2016 and 2017 continue to be on the downside, with close to a nine-in-ten chance that inflation is less than 1% in 2016. The probability of inflation greater than 3% is forecast to be essentially zero in 2016, rising to a modest 5% in 2017. The WBS forecasting system therefore continues to place a higher probability on the currently low inflation in the UK persisting, consistent with the downward revision in inflation forecasts by the Bank of England and other forecasters in recent months.
Comparison with other forecasters
The main objective of the WBS forecasting system is to provide benchmark and judgement-free probability forecasts; and to assess the risks associated with other forecasts when these do not involve a direct communication of forecast uncertainty.
Accordingly, we take the most recent forecasts from the OECD, the Bank of England and HMT’s Panel of Independent Forecasters. While the Bank of England provides an explicit assessment of forecast uncertainties for the UK, via “fan charts”, the OECD and HMT Panel provide point forecasts only.
We use the WBS forecasting system histograms to compute the probability that GDP growth or inflation is greater than the other forecaster’s “point” forecast. If the point forecast from the other forecaster falls in the centre of the WBS forecast distribution we would expect this probability to be 50%. On the other hand, if the forecaster is more optimistic (pessimistic) than we suggest they should have a probability less (greater) than 50%.
Table 2: Forecast Comparison for 2016
|
|
Real GDP Growth (%, p.a.) |
CPI Inflation (%, p.a.) |
||
|
|
Point Forecast |
Prob. of a higher outturn |
Point Forecast |
Prob. of a higher outturn |
|
OECD[1] |
2.1 |
0.49 |
1.5 |
0.04 |
|
Bank of England1 |
2.2 |
0.46 |
0.6 |
0.32 |
|
HMT Panel |
2.2 |
0.45 |
0.7 |
0.25 |
Table 3: Forecast Comparison for 2017
|
|
Real GDP Growth (%, p.a.) |
CPI Inflation (%, p.a.) |
||
|
|
Point Forecast |
Prob. of a higher outturn |
Point Forecast |
Prob. of a higher outturn |
|
OECD[1] |
2.0 |
0.66 |
2.0 |
0.18 |
|
Bank of England1 |
2.3 |
0.58 |
1.6 |
0.28 |
|
HMT Panel |
2.2 |
0.59 |
1.7 |
0.25 |
Looking at GDP growth, Tables 2 and 3 indicate that the point forecasts from the OECD, Bank of England and HMT Panel fall close to the centre of the range of estimates expected by the WBS forecasting system. However, there is evidence that the WBS forecasting system is slightly more pessimistic about growth in 2016 than the other forecasters, but then more optimistic about growth prospects for 2017.
What is more marked is that we have revised up our estimates of the downside risks to GDP growth in 2016. Last quarter we forecast a 21% chance of growth between 1% and 2% in 2016; we now forecast there to be a 35% chance. This is despite the fact that the most likely outcome for GDP growth in 2016 remains growth between 2% and 3% (the probability is around 40%, similar to last quarter). These elevated downside risks in 2016 are consistent with the OECD recently revising down by 0.3 percentage points their point forecasts for UK growth in 2016. The WBS forecasting system is, however, not expecting this asymmetry in the balance of risks to continue into 2017 - as the 2017 GDP growth forecast distribution is more symmetric (see Figure above).
For inflation there is more disagreement. The WBS forecasting system is more confident than the other forecasters that the current low inflation rates in the UK will persist through 2016 into 2017. This is evidenced by the fact that the inflation point forecasts for 2017 from the other three forecasters clearly fall in the right-hand-side of the WBS forecasting system histogram. The system accordingly suggests that, depending on the forecaster examined in Table 3, there is between a 72% and 82% chance that inflation falls below their central expectations for 2017.
[1] The OECD GDP growth forecasts were updated in mid-February 2016, while the OECD’s inflation forecasts date back to November 2015 and are therefore considerably “older” forecasts – to emphasise this informational disadvantage, the OECD inflation forecasts are placed in italics in Tables 2 and 3. The Bank of England (mean) forecasts for calendar year inflation are derived from their published forecasts for the four-quarter inflation rate and are, therefore, to be treated as approximate. .