
WBS UK Probabilistic Forecasts, Nov 2016
The figure below presents WBS’s latest (as of 25th November 2016) probabilistic forecasts for real GDP growth and inflation – for 2016 and 2017 – as histograms.
We emphasise that these forecasts, by design, are produced by a judgement-free forecasting system and do not explicitly condition on or directly model the macroeconomic effects of Brexit or make assumptions about the nature of the Brexit negotiations. They provide a best-guess of the likely future direction of the UK economy if historical patterns in macroeconomic data persist. As we discuss below, deviation of these forecasts from the forecasts of others (who do seek, often by applying judgement, to anticipate the effects of Brexit) provides one way of quantifying their view of the expected macroeconomic effects of the UK’s recent decision to leave the European Union.
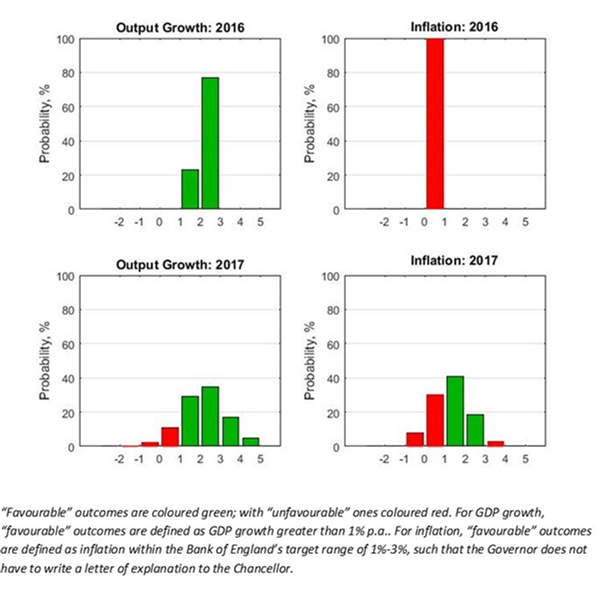
Inspection of both the figure and Table 1 below reveals that, if historical patterns in the currently (Nov 2016) available data do repeat themselves, economic growth in the UK is expected to continue through into 2017, with the most likely outcome being growth of between 2% and 3%. But Brexit, of course, may well change this and lead to the breakdown of historical patterns and relationships in macroeconomic data. What is especially uncertain is how business and consumer anxiety about the outcome of the Brexit negotiations will affect macroeconomic relationships.
Table 1: Probability Event Forecasts for Annualised % Real GDP Growth and CPI Inflation (extracted from the WBS forecast histograms)
Year |
Real GDP Growth (%, p.a.) |
CPI Inflation (%, p.a.) |
||||
|
|
Prob(growth<0%) |
Prob(growth<1%) |
Prob(growth<2%) |
Prob(letter) |
Prob(CPI<1%) |
Prob(CPI>3%) |
2016 |
<1% |
<1% |
23% |
>99% |
>99% |
<1% |
2017 |
3% |
13% |
43% |
41% |
38% |
3% |
While inflation is strongly predicted by the WBS forecasting system to fall beneath its 1% targeted lower bound in 2016, the outcomes for 2017 are more uncertain. Relative to a quarter ago, inflation is expected to pick up in 2017; and again Brexit and any further depreciations of the pound may well cause this to happen at a different speed to in the past.
Comparison with other forecasters
The main objective of the WBS forecasting system is to provide benchmark and judgement-free probability forecasts; and to assess the risks associated with other forecasts when these do not involve a direct communication of forecast uncertainty.
Accordingly, we take the most recent forecasts from the Bank of England, the OBR and HMT’s Panel of Independent Forecasters. While the Bank of England and OBR provide an explicit assessment of forecast uncertainties for the UK, via “fan charts”, the HMT Panel provide point forecasts only.
We use the WBS forecasting system histograms to compute the probability that GDP growth or inflation is greater than the other forecaster’s “point” forecast. If the point forecast from the other forecaster falls in the centre of the WBS forecast distribution we would expect this probability to be 50%. On the other hand, if the forecaster is more optimistic (pessimistic) than we suggest they should have a probability less (greater) than 50%.
Table 2: Forecast Comparison for 2016
|
|
Real GDP Growth (%, p.a.) |
CPI Inflation (%, p.a.) |
||
|
|
Point Forecast |
Prob. of a higher outturn |
Point Forecast |
Prob. of a higher outturn |
Bank of England[1] |
2.09 |
0.51 |
0.67 |
0.06 |
HMT Panel |
2.00 |
0.77 |
0.70 |
0.03 |
OBR |
2.10 |
0.42 |
0.70 |
0.03 |
Table 3: Forecast Comparison for 2017
|
|
Real GDP Growth (%, p.a.) |
CPI Inflation (%, p.a.) |
||
|
|
Point Forecast |
Prob. of a higher outturn |
Point Forecast |
Prob. of a higher outturn |
Bank of England1 |
1.41 |
0.77 |
2.44 |
0.10 |
HMT Panel |
1.10 |
0.85 |
2.70 |
0.06 |
OBR |
1.40 |
0.77 |
2.30 |
0.13 |
Looking at GDP growth, Table 2 shows that all three forecasters agree with the WBSFS that growth in 2016 will likely just exceed 2%. But the GDP growth forecasts for 2017 shown in Table 3 indicate that all three forecasters are much more pessimistic about prospects for GDP growth in the UK. Their forecasts for 2017 clearly deviate from the WBS benchmark forecasts produced under the assumption that historical relationships and patterns persist in the current macroeconomic data and are not broken in the aftermath of Brexit.
Tables 2 and 3 also reveal how the Bank of England, HMT and OBR are much more confident that inflation will turn out higher than historical patterns in the data would lead us to suggest. In particular, likely anticipating the effects of the depreciation in the pound since Brexit, all three forecasters expect inflation to exceed 2% in 2017, while WBSFS predicts only a 21% probability that the inflation will rise above 2%.
Note on the Warwick Business School Forecasting System
The Warwick Business School Forecasting System communicates forecast uncertainties for UK GDP growth and inflation in an open and transparent way – free from judgement. The system involves consideration of a range of cutting-edge econometric forecasting models, as opposed to relying on a single model which is likely misspecified.
Focus is on the production and publication of accurate probabilistic forecasts, using statistical methods, rather than constructing a narrative or story around one particular, but likely far from certain, possible set of outturns.
The WBS forecasts thus emphasise forecast uncertainties; and provide a benchmark against which one can assess the plausibility of other forecasts.
[1] The Bank of England (mean) forecasts for calendar year inflation are derived from their published forecasts for the four-quarter inflation rate and are, therefore, to be treated as approximate.