
WBS UK Probabilistic Forecasts, Nov 2017
WBS forecasts for 2017 and 2018
The figure below presents WBS’s latest (as of 23rd November 2017) probabilistic forecasts for real GDP growth and inflation – for 2017 and 2018 – as histograms.
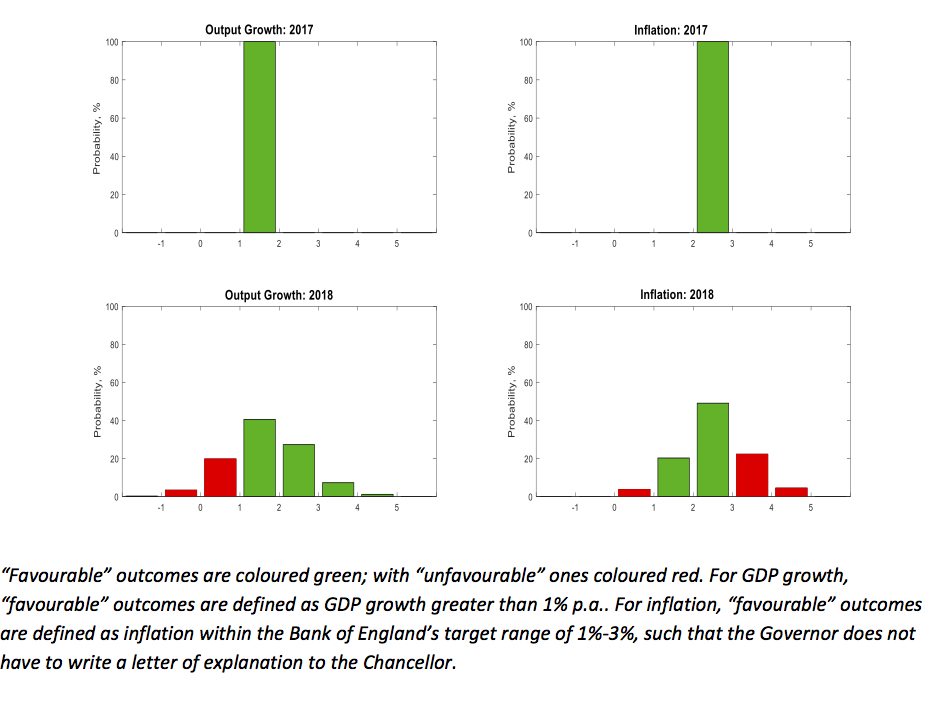
Conditioning on the latest GDP data from the ONS for 2017Q3, both the figure and Table 1 below reveal that economic growth of between 1% and 2% is forecast for 2017, with near certainty. Relative to one quarter ago, the probability of lacklustre growth of less than 2% has increased from 88% to near 100%, suggesting uncertainty only within the narrow 1-2% range. At the same time, the forecast density for growth in 2018 has been revised downwards. Relative to one quarter ago, there has been a reduction in the probability of growth greater than 2% from 55% to 36%. And there is now a much reduced 9% chance of growth greater than 3% in 2018, down from 25% one quarter ago.
The inflation outlook for 2017 also reflects the fact that we now have data for much of 2017 - there is now a near zero probability that inflation exceeds 3% in 2017 – the probability has fallen from 10%. There remains, however, a 27% probability that inflation exceeds 3% in 2018, a slight rise from the probability forecast of 23% one quarter ago. The inflation density for 2018 has shifted slightly to the right.
Table 1: Probability Event Forecasts for Annualised % Real GDP Growth and CPI Inflation
Year |
Real GDP Growth (%, p.a.) |
CPI Inflation (%, p.a.) |
||||
|
|
Prob(growth<0%) |
Prob(growth<1%) |
Prob(growth<2%) |
Prob(letter) |
Prob(CPI<1%) |
Prob(CPI>3%) |
2017 |
<1% |
<1% |
100% |
<1% |
<1% |
<1% |
2018 |
4% |
24% |
64% |
31% |
4% |
27% |
Comparison with other forecasters
The main objective of the WBS forecasting system is to provide benchmark and judgement-free probability forecasts; and to assess the risks associated with other forecasts.
Accordingly, we take the most recent point forecasts from the Bank of England, the HMT panel of independent forecasts, the National Institute of Economic and Social Research and the OBR.
We use the WBS forecasting system histograms to compute the probability that GDP growth or inflation is greater than the other forecaster’s “point” forecast. If the point forecast from the other forecaster falls in the centre of the WBS forecast distribution we would expect this probability to be 50%. On the other hand, if the forecaster is more optimistic (pessimistic) than we suggest they should have a probability less (greater) than 50%.
Table 2: Forecast Comparison for 2017
|
|
Real GDP Growth (%, p.a.) |
CPI Inflation (%, p.a.) |
||
|
|
Point Forecast |
Prob. of a higher outturn |
Point Forecast |
Prob. of a higher outturn |
Bank of England[1] |
1.57 |
0.24 |
2.57 |
0.59 |
HMT Panel |
1.60 |
0.18 |
2.70 |
0.08 |
NIESR |
1.50 |
0.40 |
2.80 |
0.01 |
OBR |
1.50 |
0.40 |
2.70 |
0.08 |
Table 3: Forecast Comparison for 2018
|
|
Real GDP Growth (%, p.a.) |
CPI Inflation (%, p.a.) |
||
|
|
Point Forecast |
Prob. of a higher outturn |
Point Forecast |
Prob. of a higher outturn |
Bank of England1 |
1.69 |
0.48 |
2.42 |
0.55 |
HMT Panel |
1.50 |
0.56 |
2.60 |
0.45 |
NIESR |
1.50 |
0.56 |
2.70 |
0.40 |
OBR |
1.40 |
0.61 |
2.40 |
0.55 |
Table 2 shows that the other forecasters are more optimistic about GDP growth in 2017 than the WBSFS, as the probability of a higher outturn is less than 0.5. But, this disagreement is within the narrow 1%-2% range; reflecting the fact that we now have data for much of 2017; all forecasters agree with the WBSFS that GDP growth in 2017 is almost certainly between 1% and 2%.
But there is more uncertainty about GDP growth prospects for 2018. According to the WBSFS, the HMT Panel, NIESR and OBR are slightly too pessimistic, with the WBSFS suggesting a greater than 50% chance that growth exceeds their point forecast. But these numbers are closer to 50% than in previous quarters, reflecting a growing consensus of lacklustre GDP growth in 2018.
Table 2 also shows that the Bank of England’s forecasts for inflation in 2017 fall much closer to the centre of the WBSFS forecast distribution than those of the HMT, NIESR and OBR - the Bank of England and the WBSFS anticipate lower inflation this year. But, as with GDP growth, reflecting the data now available for 2017, there is in fact little disagreement between the forecasters about inflation prospects for this year. Looking ahead to 2018, Table 3 shows that the WBSFS now forecasts a 55%, 45%, 40% and 56% chance that inflation in 2018 exceeds the Bank, HMT Panel, NIESR and OBR forecasts, respectively. One quarter ago there was less consensus that inflation in 2018 would be around 2.5%.
Note on the Warwick Business School Forecasting System
The Warwick Business School Forecasting System communicates forecast uncertainties for UK GDP growth and inflation in an open and transparent way – free from judgement. The system involves consideration of a range of cutting-edge econometric forecasting models, as opposed to relying on a single model which is likely misspecified.
Focus is on the production and publication of accurate probabilistic forecasts, using statistical methods, rather than constructing a narrative or story around one particular, but likely far from certain, possible set of outturns.
The WBS forecasts thus emphasise forecast uncertainties; and provide a benchmark against which one can assess the plausibility of other forecasts.
[1] The Bank of England (mean) forecasts for calendar year inflation are derived from their published forecasts for the four-quarter inflation rate and are, therefore, to be treated as approximate.